We all know setting up python or creating slow and non interactive charts in Excel sucks.
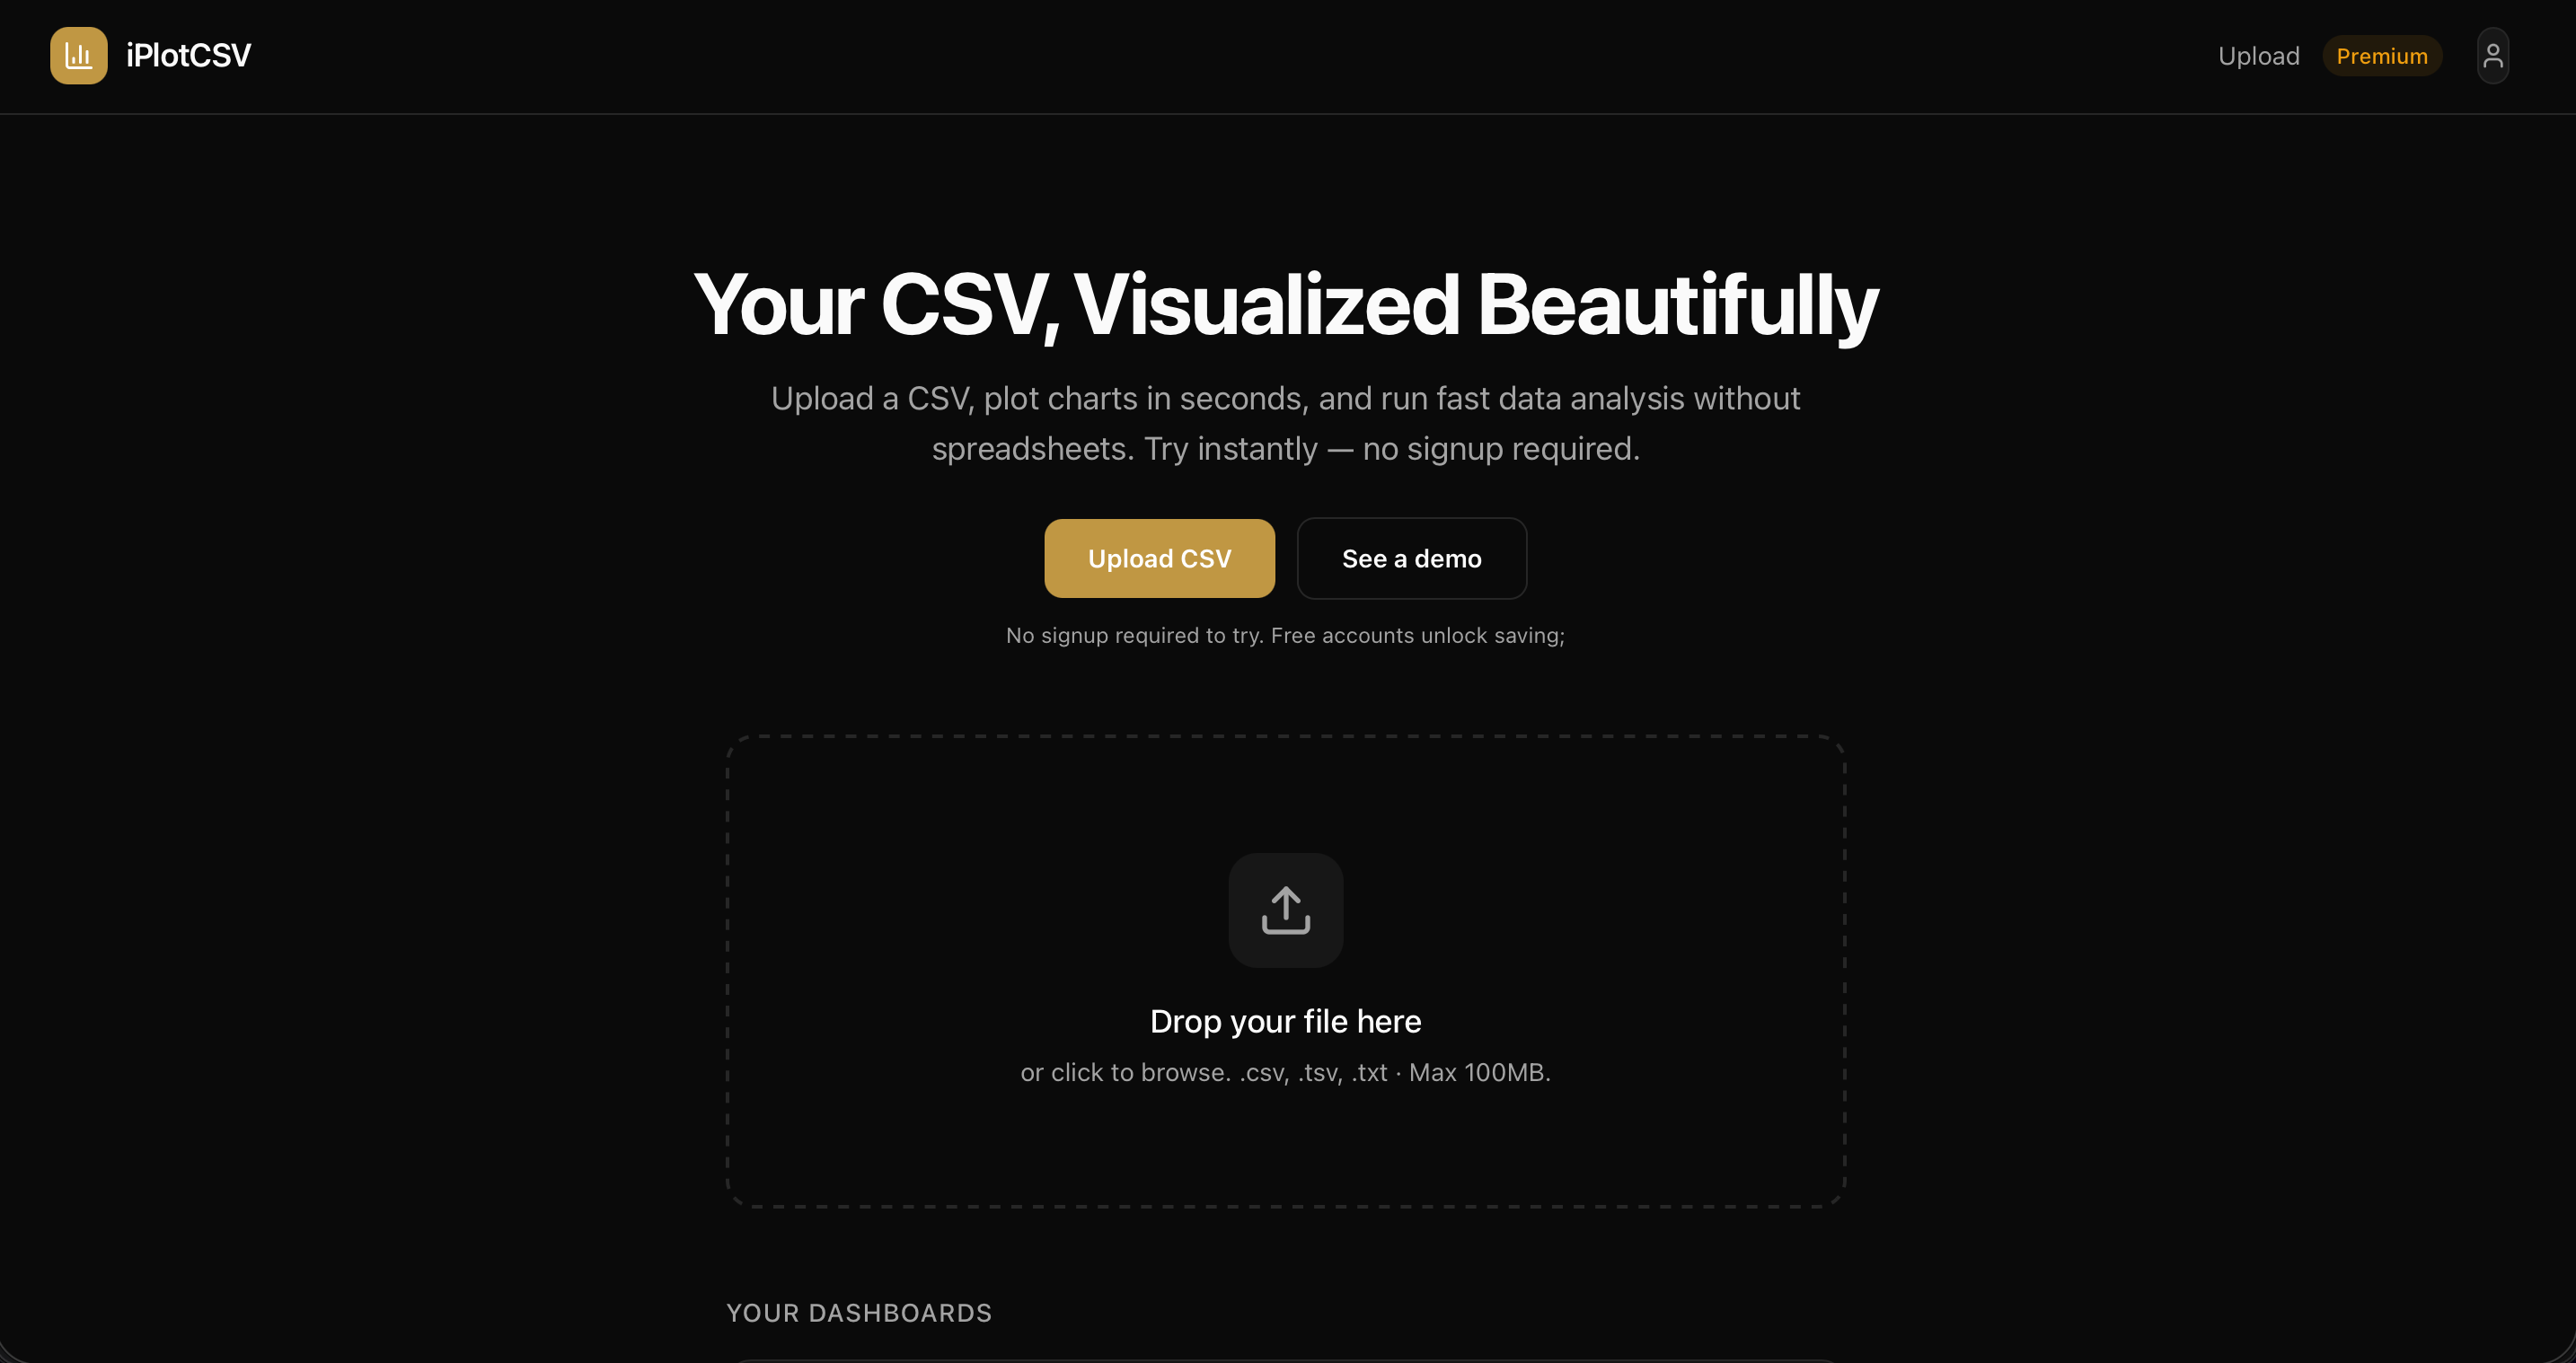
iPlotCSV is a web tool for visualizing CSVs. Drop your file, pick your columns, get an interactive chart. That's it. No signup.
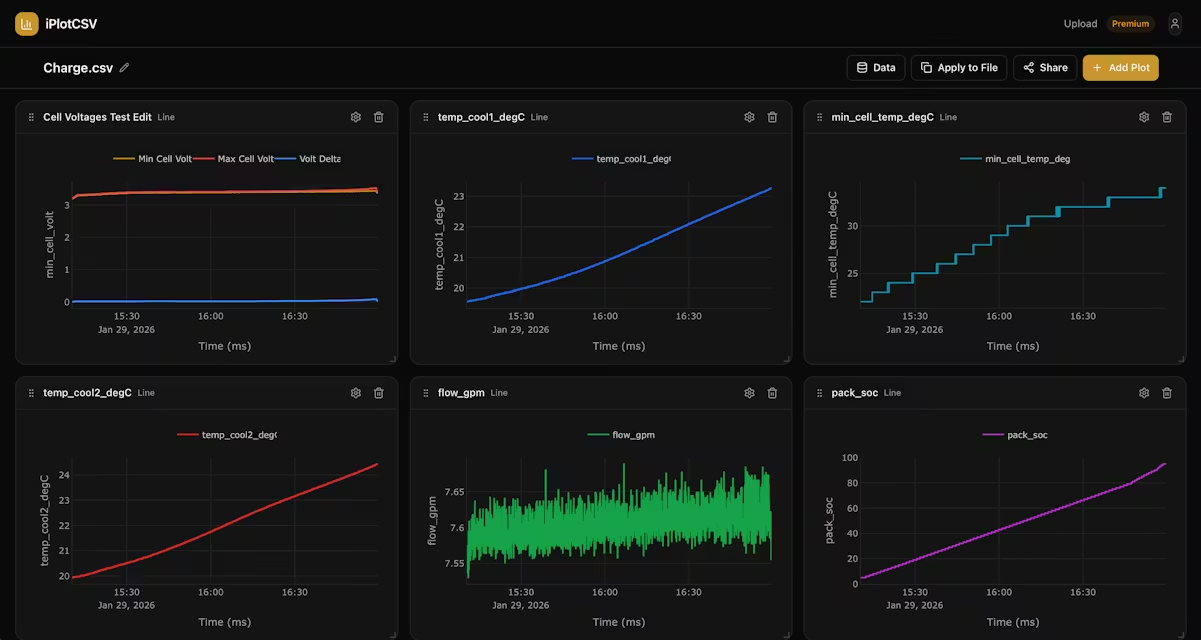
Includes a full suite of post processing tools, filters, engineering functions for strain gauges, etc.
Screenshots
Product Updates (0)
No updates yet. Check back later for updates from the team.

Comments (1)
visit https://iplotcsv.com/demo to try out all features