
ScoreCasa
Data-driven property investment analysis
Details
- Categories
- Analytics & MonitoringFintech
- Use Cases
- Data AnalysisAnalytics & Reporting
- Target Audience
- Non-Technical Users
- Platforms
- Web
About ScoreCasa
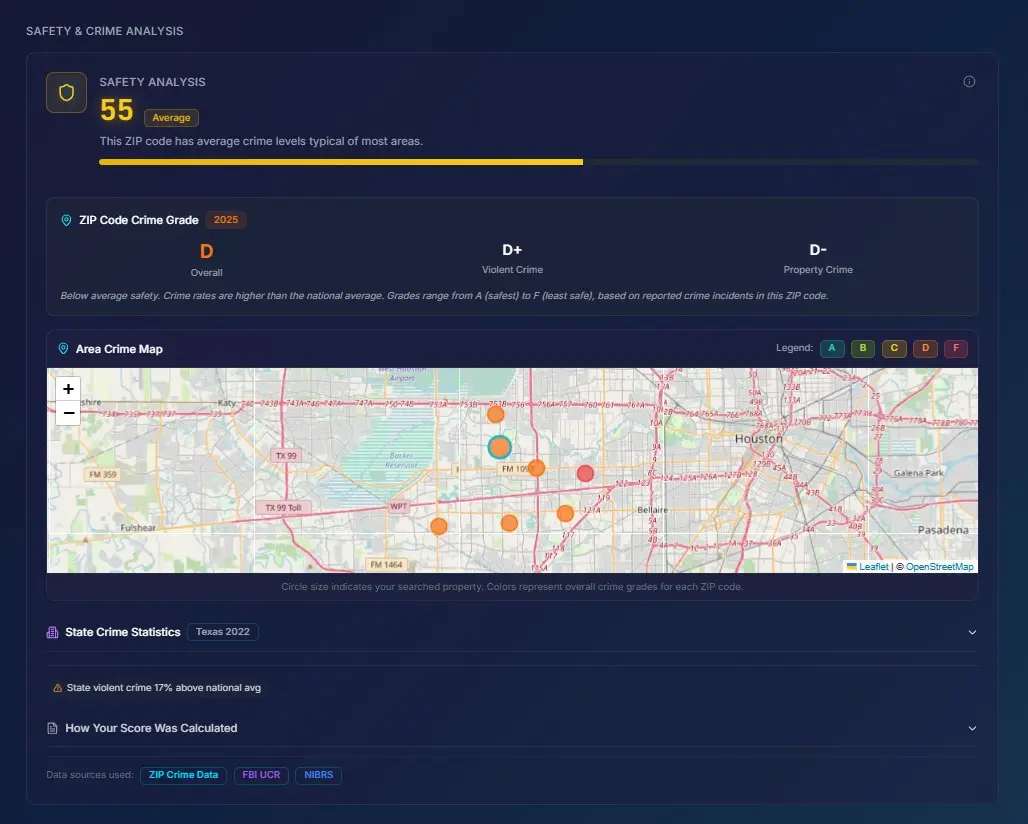
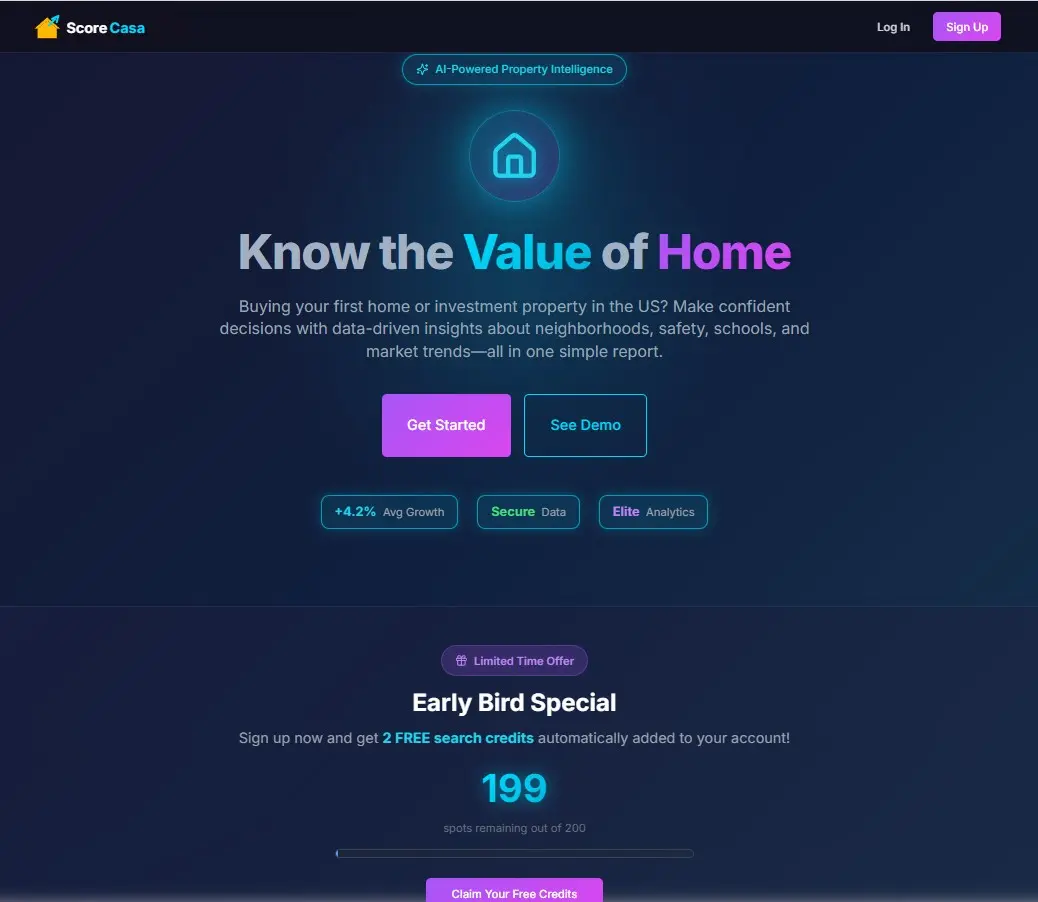
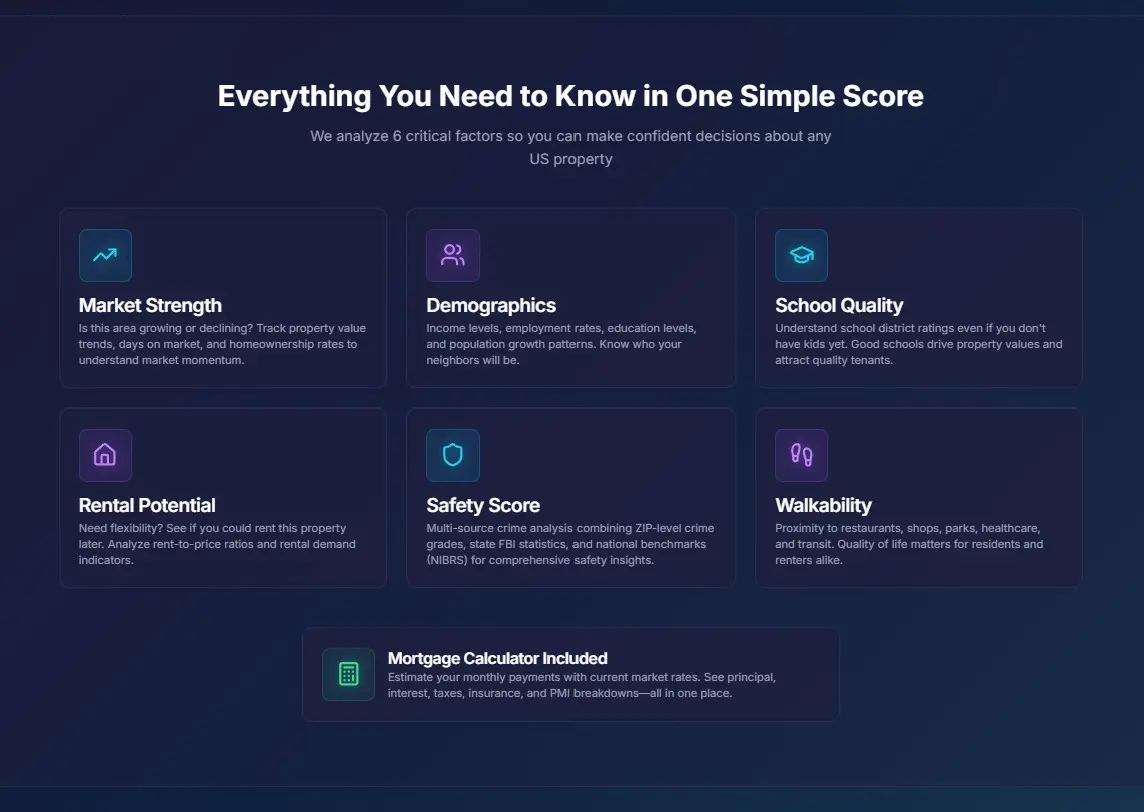
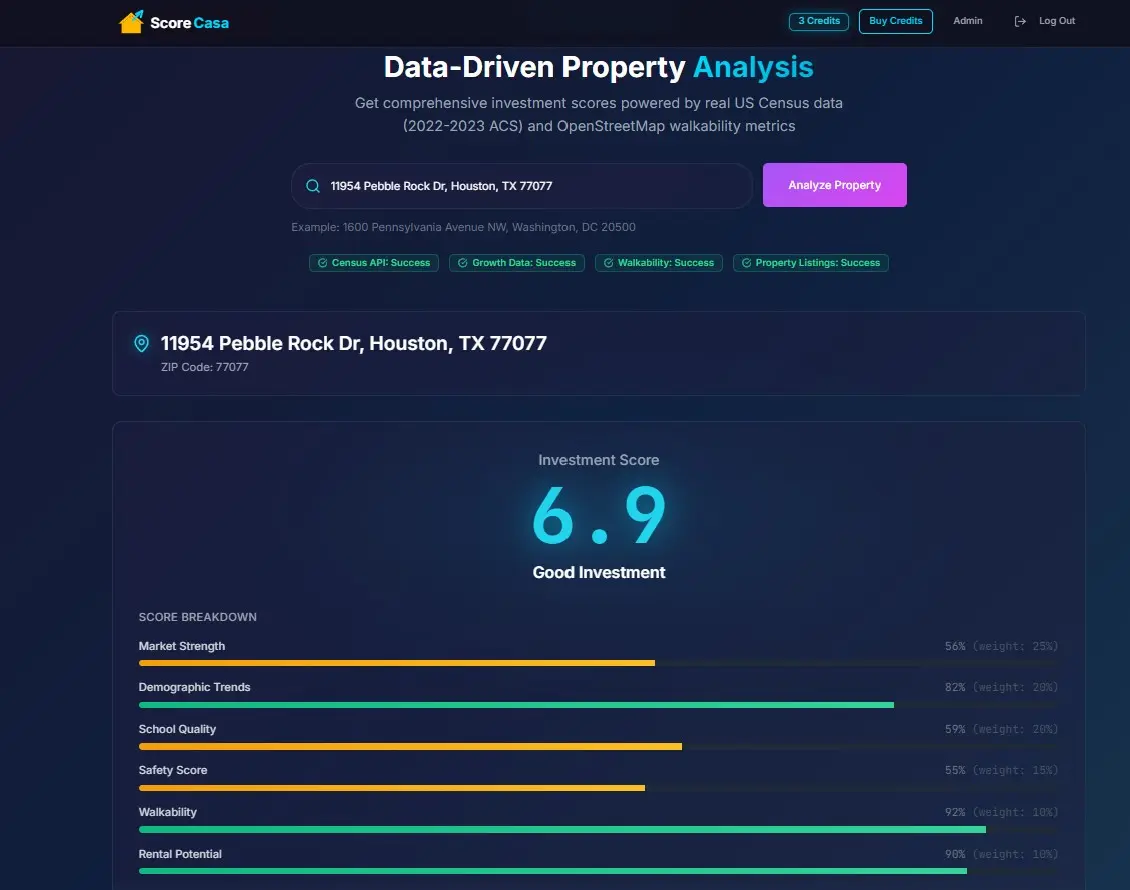
ScoreCasa is an AI-powered property report that turns scattered US housing, crime, school, and neighborhood data into one simple score so first-time buyers can quickly see if a home is a smart, safe bet.
Product Insights
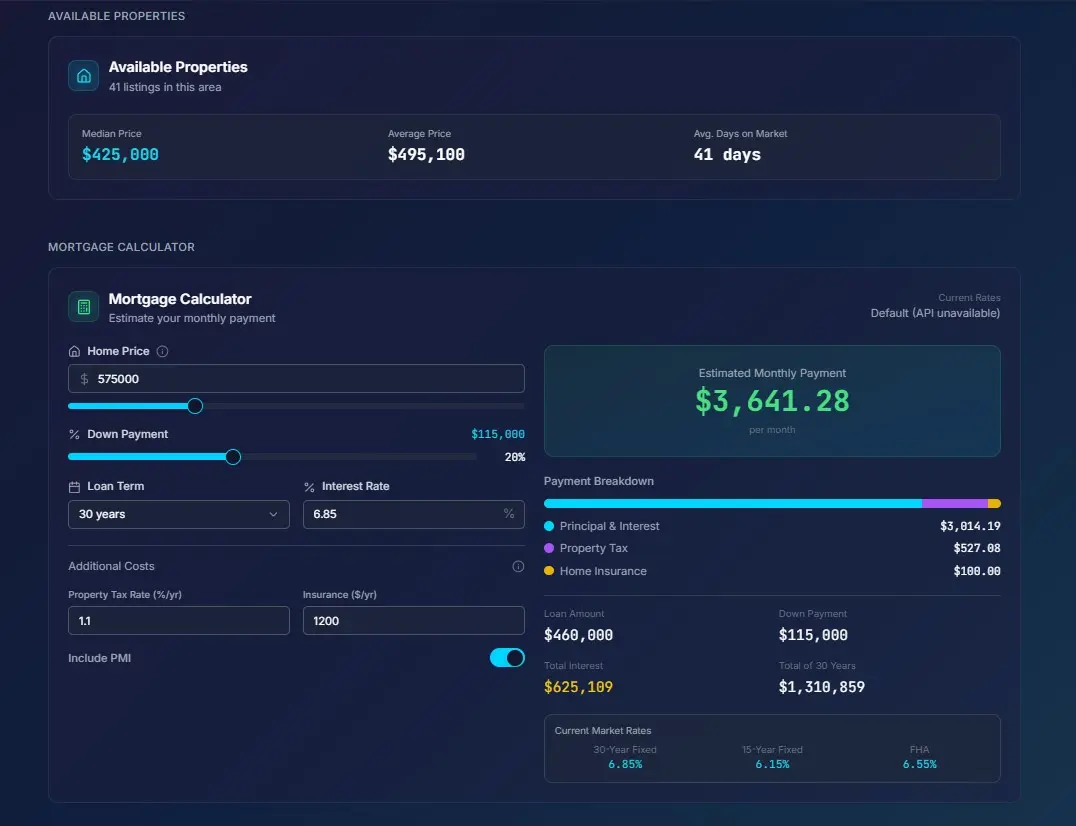
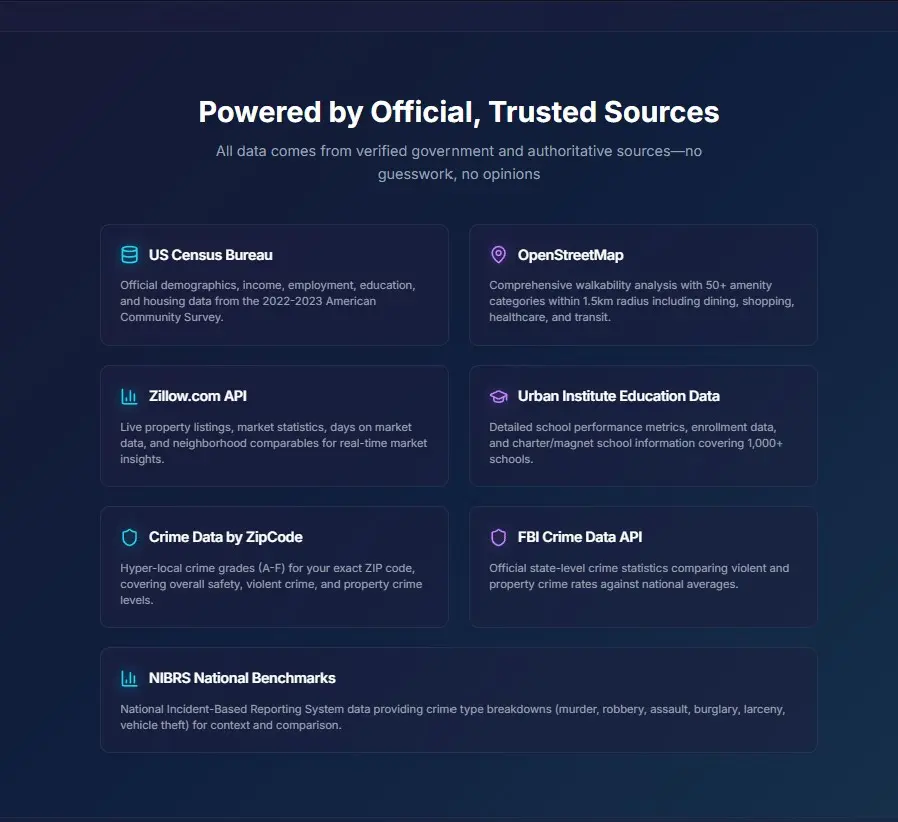
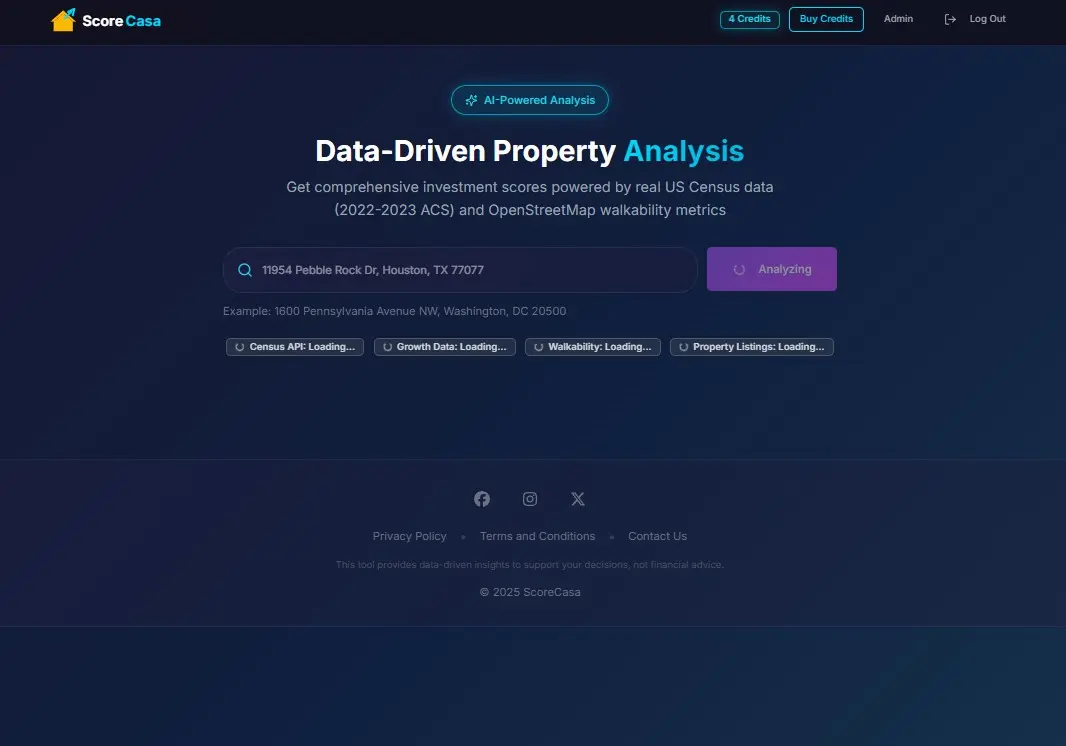
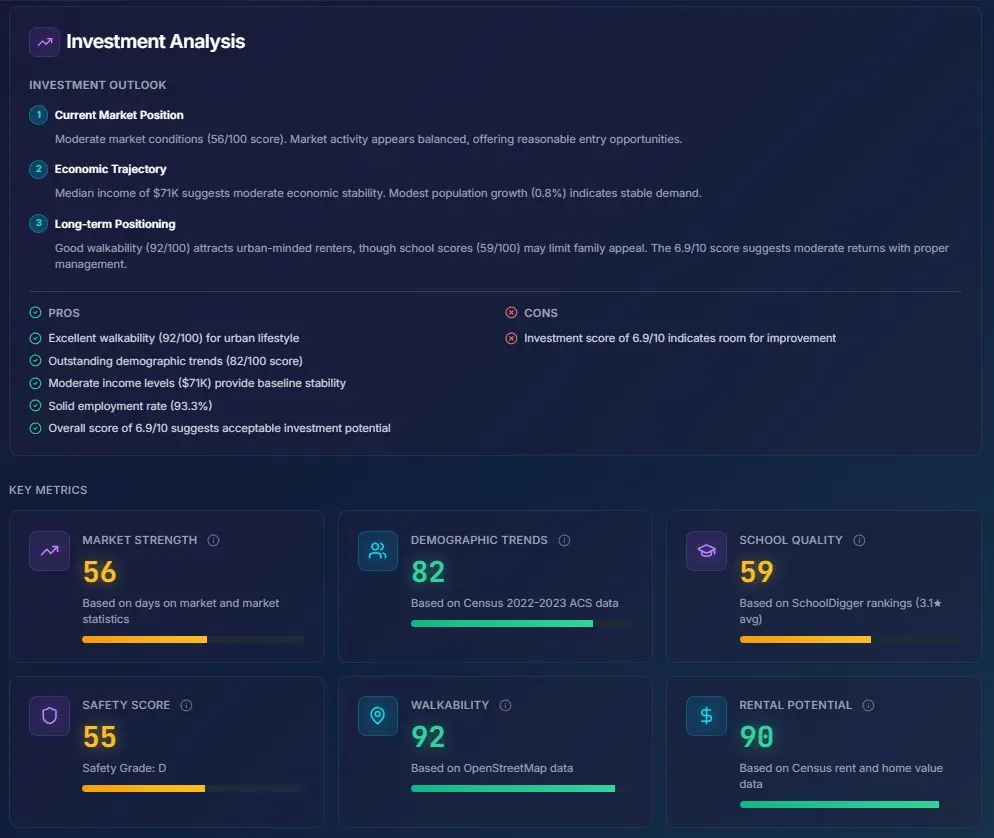
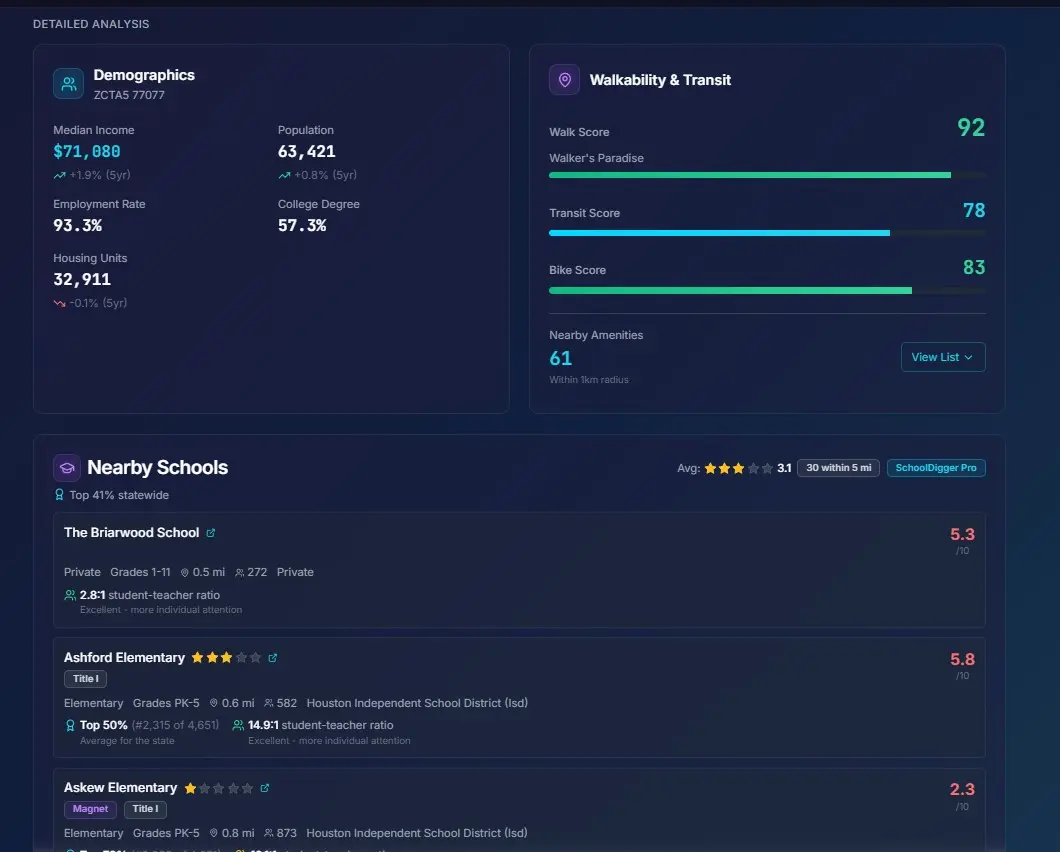
ScoreCasa provides web-based property analysis by aggregating US housing, crime, and school data into unified safety and investment scores. The platform integrates market velocity metrics and predictive rent forecasts to assist non-technical users in evaluating residential real estate.
- Comprehensive investment calculators for cash flow, cap rate, and cash-on-cash return benchmarks.
- Integrated 1-year home value and rent forecasts by ZIP, metro, and state levels.
- Unified scoring system combining market strength, safety data, and property-specific estimates.
- Market velocity tracking including days to pending and sale-to-list ratios.
Ideal for: Non-technical users seeking a simplified way to evaluate US property investments through data-driven scores and financial calculators.
Screenshots
Product Updates (2)
Investment Calculators Feature
New Component Added: • Cash Flow Calculator - Shows monthly/annual cash flow with complete expense breakdown and 1% Rule check • Cap Rate Calculator - Calculates Net Operating Income (NOI) and Cap Rate with Class A/B/C benchmarks and Gross Rent Multiplier (GRM) • Cash-on-Cash Return Calculator - Shows return on actual cash invested with comparison benchmarks • Maximum Offer Price Calculator - Reverse-calculates the max price you can pay to achieve your target return Key Features: • All calculators auto-populate with real data from property analysis (price, rent estimates, mortgage rates, tax rates) • Educational guidance cards explain each metric in simple terms for first-time investors • Tooltips on every input field • Color-coded badges showing good/fair/poor performance thresholds
Comments (2)


New Data Source added
New Data Sources Added: • 1-year home value forecasts by ZIP, metro, and state • 1-year rent forecasts at national level • Market velocity metrics: days to pending, days to close, sale-to-list ratios • Downloaded monthly from free CSV files and cached in database • Property-specific rental estimates and comparables • Intelligent 30-day caching • Quota tracking with automatic monthly reset Scoring Integration: • Market Strength score now includes home value forecasts (15 pts), days to pending (10 pts), and sale-to-list ratio (10 pts) • Rental Potential score now includes rent growth forecasts (15 pts bonus)
Comments (1)

Reviews (0)
No reviews yet. Be the first to rate this product!
Comments (5)
Love the idea!
Not a big property investor but will have to use this when browsing on zillow for fun
Had a similar ideas these days :) this is niche product but I think very needed for small investors! How did you connect those apis and data sources?
Hi, technically I can't explain it as I'm vibecoding everything, so AI does it in the back. There are paid APIs and free ones. There are some data sources that are updated monthly or yearly and the app falls back if the API request is not
Wow hoping to try it soon
Please do and happy for any feedback, roast it as much as possible :)). Free credit when signing up!! :))
I recently moved to US and this app was built on my need to have a second opinion regarding a house and the surroundings of it. It is entirely vibecoded and was a learning experience.