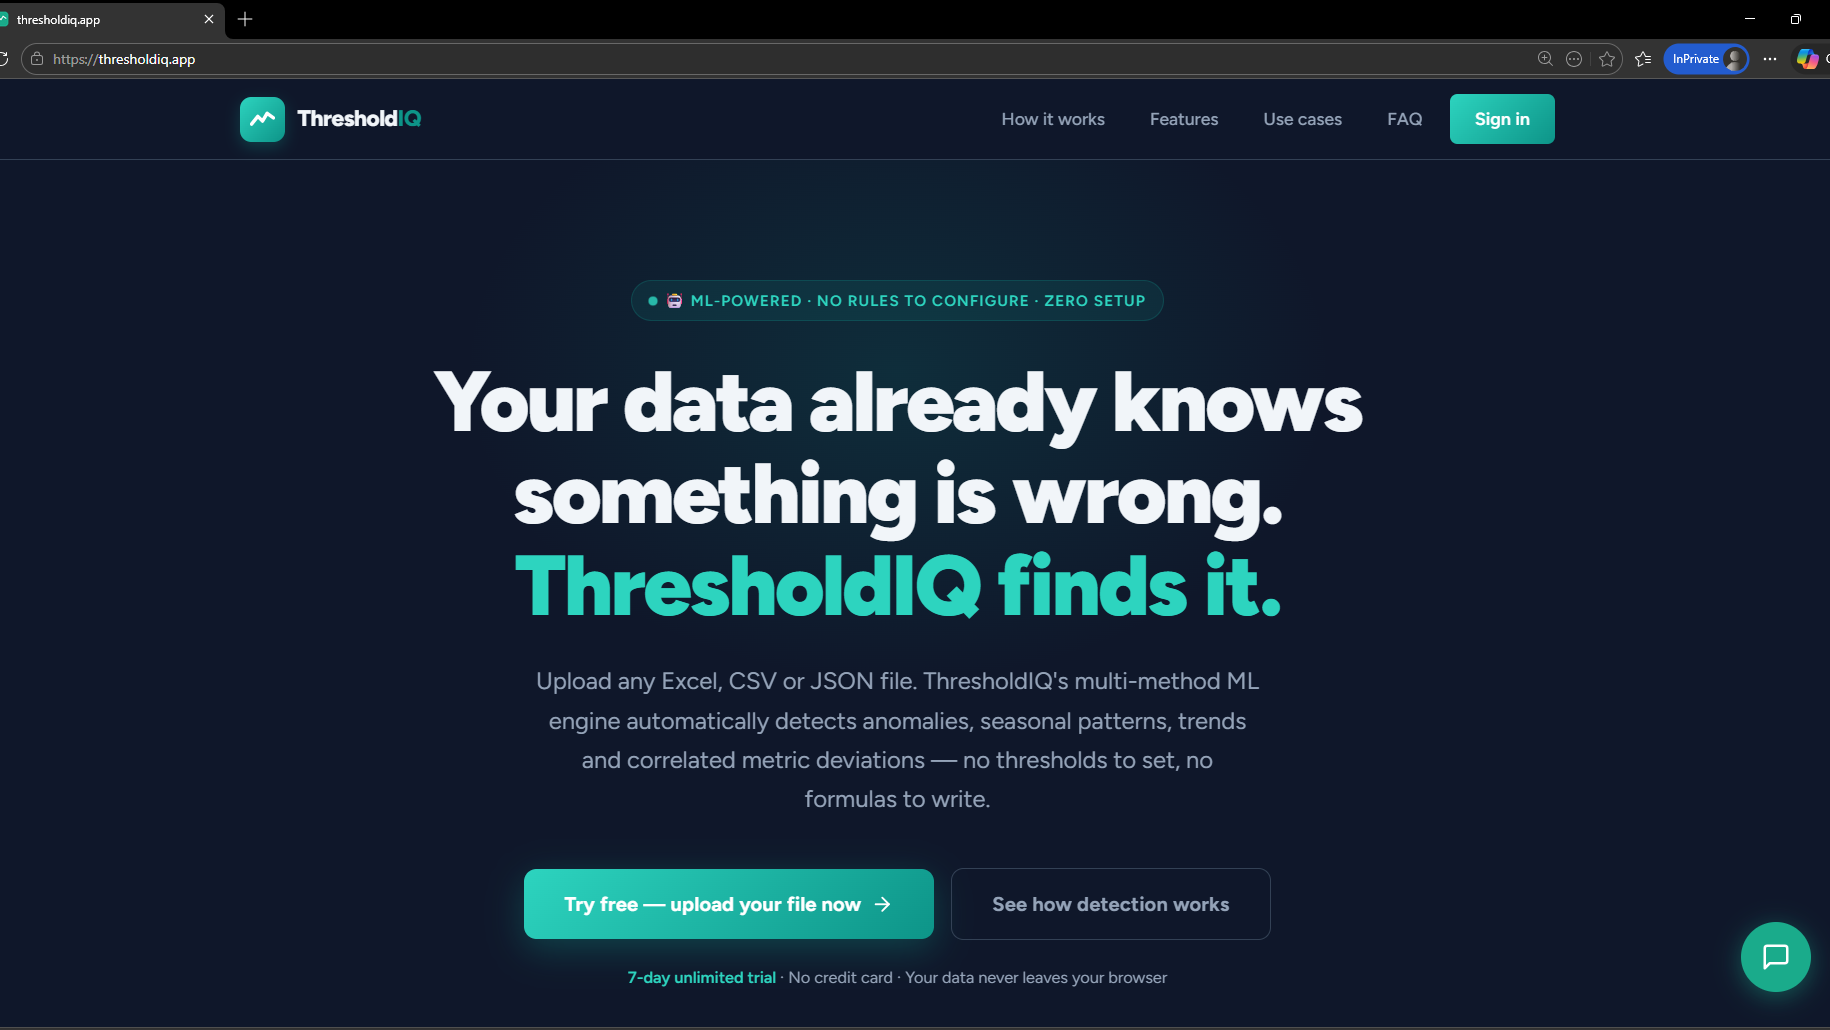
ThresholdIQ

ThresholdIQ

#Data Analysis #Data Visualization #Data Dashboard #Alert

VigneshJ
@VigneshJ
Last updated on Mar 16, 2026
Visit site
29PeerPush
PeerPush badge for ThresholdIQ

About ThresholdIQ

ThresholdIQ is a lightweight, no-code KPI monitoring platform designed to help teams quickly identify critical and warning threshold breaches across operational data. Many organizations rely on spreadsheets or manual review processes to monitor performance metrics. This approach is time-consuming, error-prone, and makes it difficult to detect trends early. ThresholdIQ simplifies this process. Users can upload datasets in multiple formats — including CSV, JSON, XML, Google Sheets, or even copy-pasted tables — and instantly visualize how metrics evolve over time. The platform classifies values into Normal, Warning, and Critical ranges based on defined thresholds and presents them in a clear, trend-focused dashboard. Key Capabilities: Multi-format data ingestion (CSV, XML, JSON, Sheets, table paste) Critical vs Warning trend visualization over time No coding or complex BI setup required Immediate insights without manual scanning Lightweight and easy to use ThresholdIQ is ideal for: Operations monitoring KPI tracking Compliance and risk analysis Performance trend analysis Features Automatic anomaly detection across 9 ML methods — no threshold configuration needed Multivariate incident grouping — correlates alerts across metrics into named incidents (voltage sag, meter fault, PF degradation, service degradation, and more) Domain-aware classification — automatically recognises AMI, oil and gas, water metering, DevOps, HVAC, and financial datasets Hybrid severity scoring — combines z-score analysis with physical domain rules, so a 41V voltage drop is always Emergency regardless of window size Alert deduplication — 5 alerts across a 7-hour window become one incident with duration and occurrence count 100% client-side processing — your data is processed in the browser and never stored or transmitted Export to CSV, PDF, and email — incident reports ready for operations teams, management, or compliance Works on any structured file — Excel, CSV, JSON, XML, up to 100,000 rows No installation, no account required to try — results in under 60 seconds Teams that need fast visibility without enterprise BI complexity The goal is simple: help users detect issues earlier, act faster, and eliminate hours of manual spreadsheet review.

Product Insights

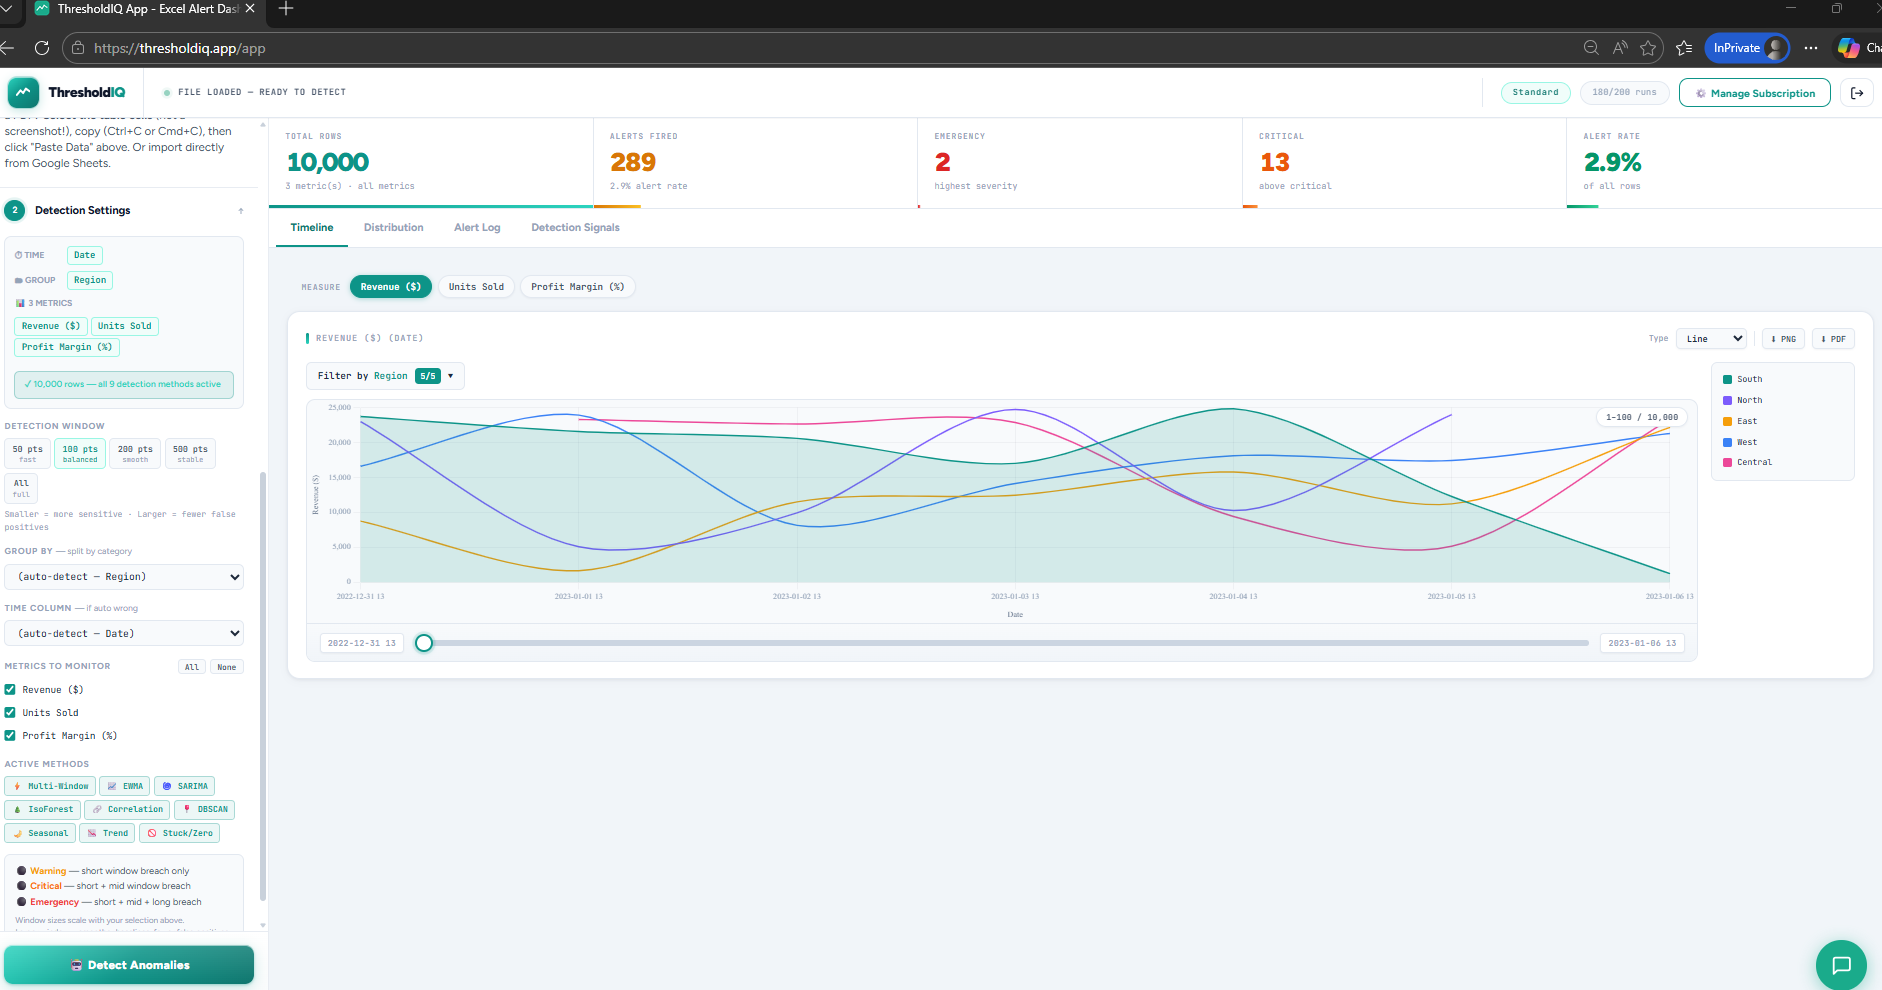
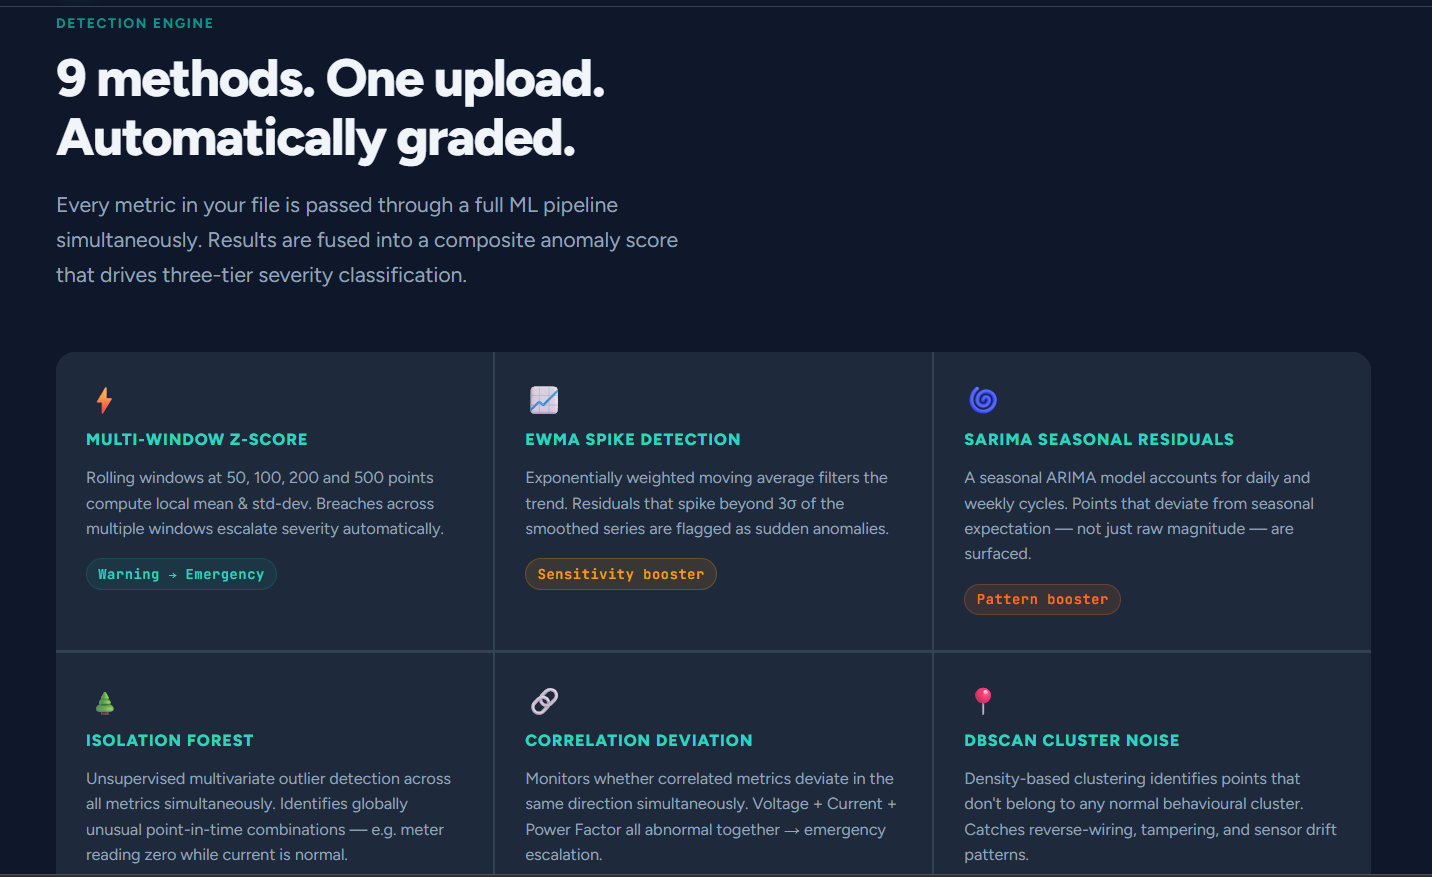
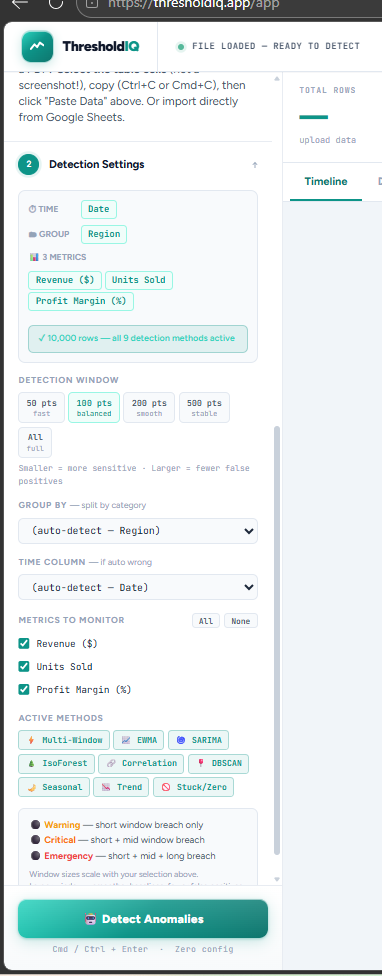
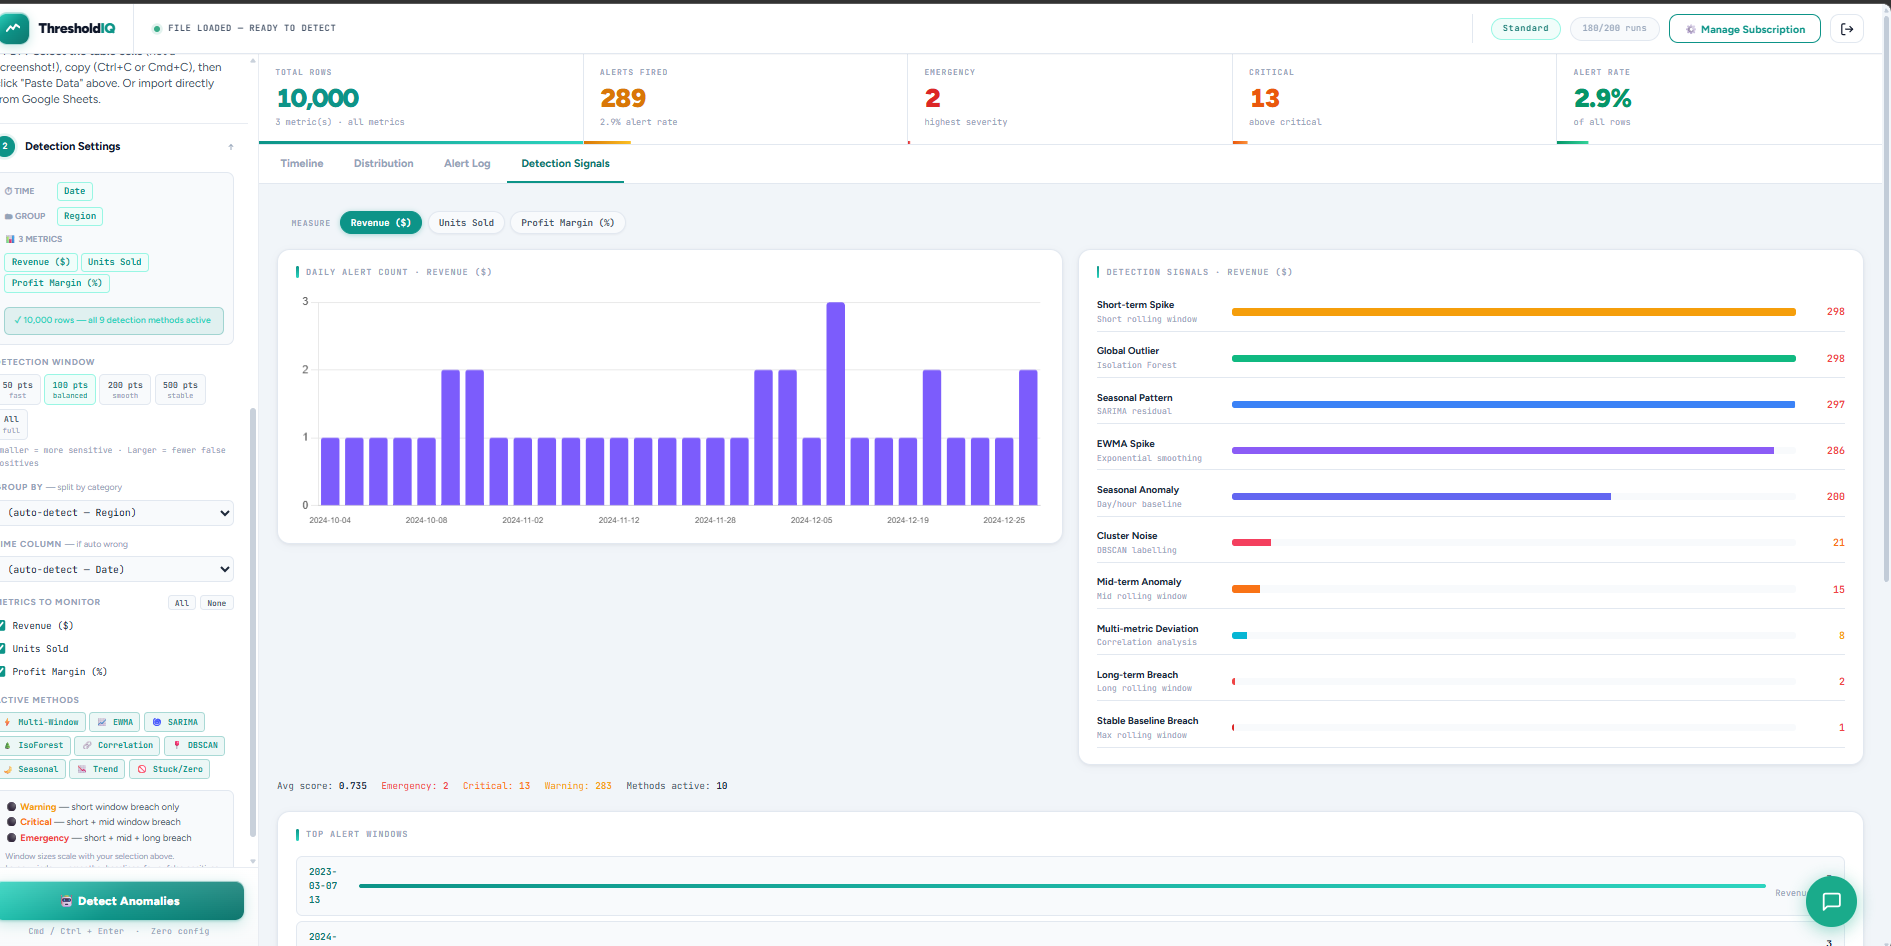
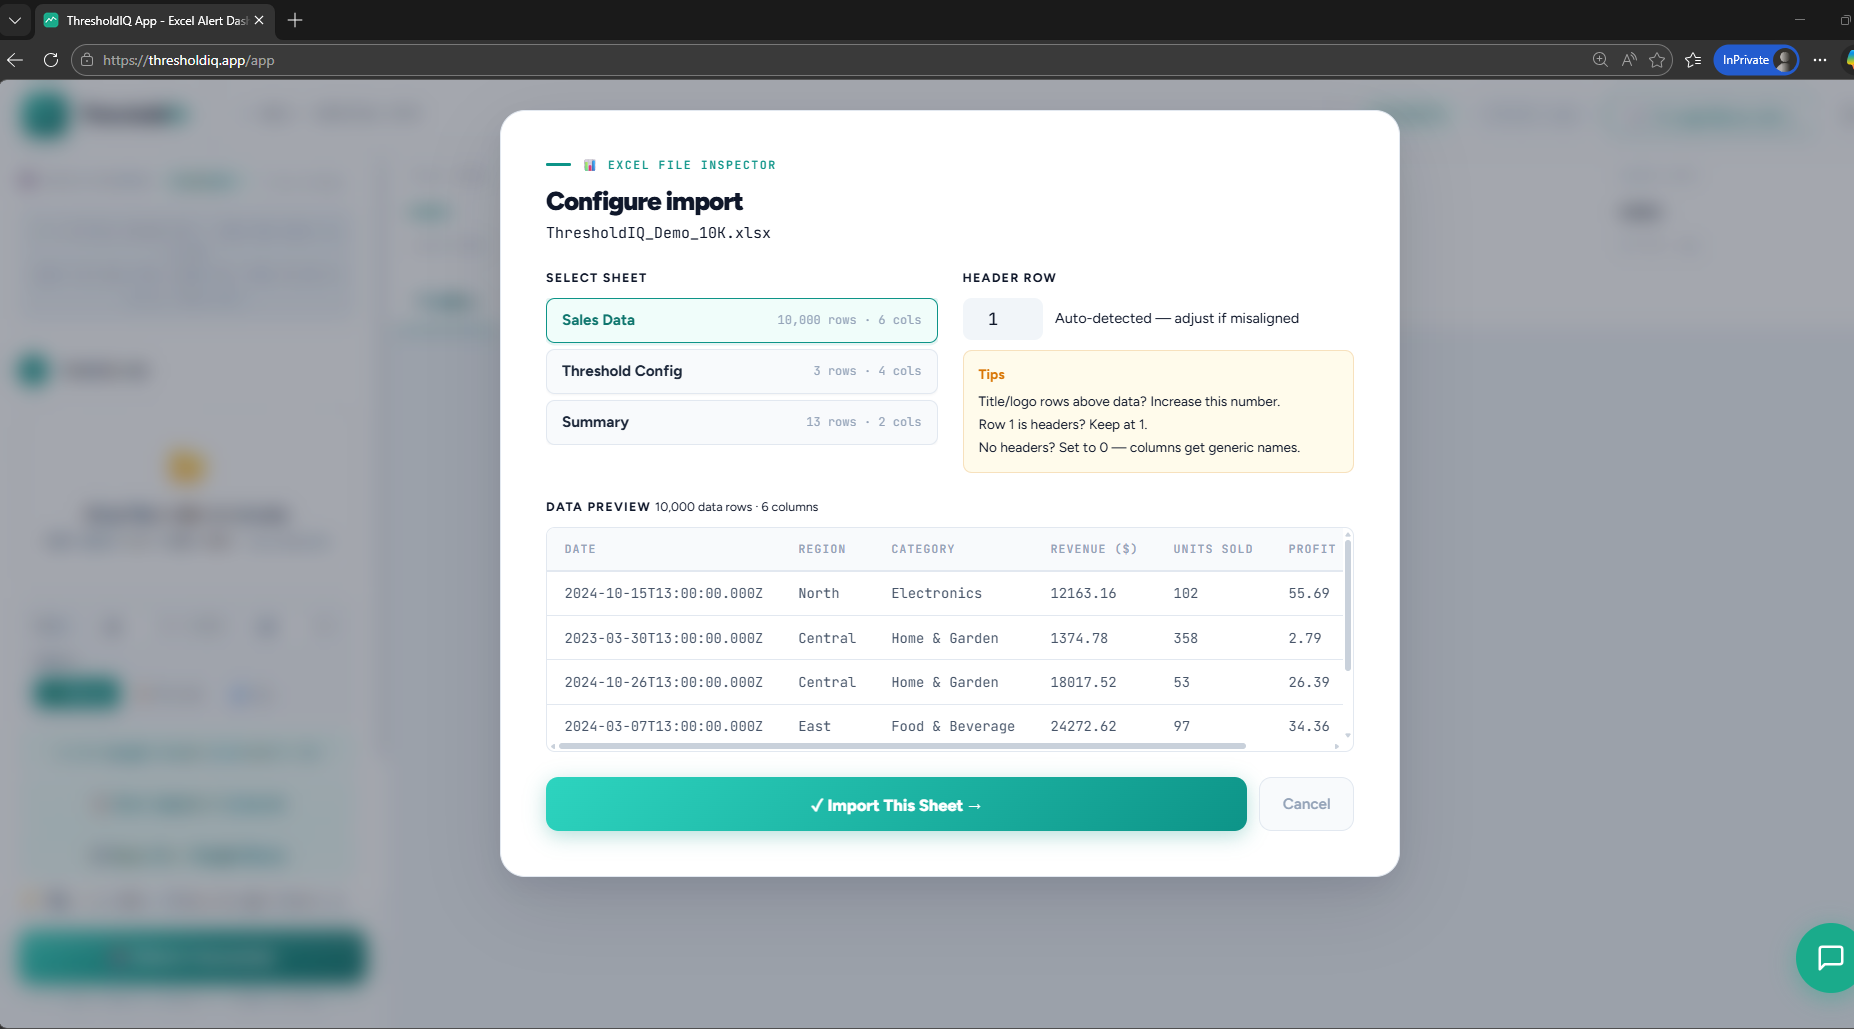
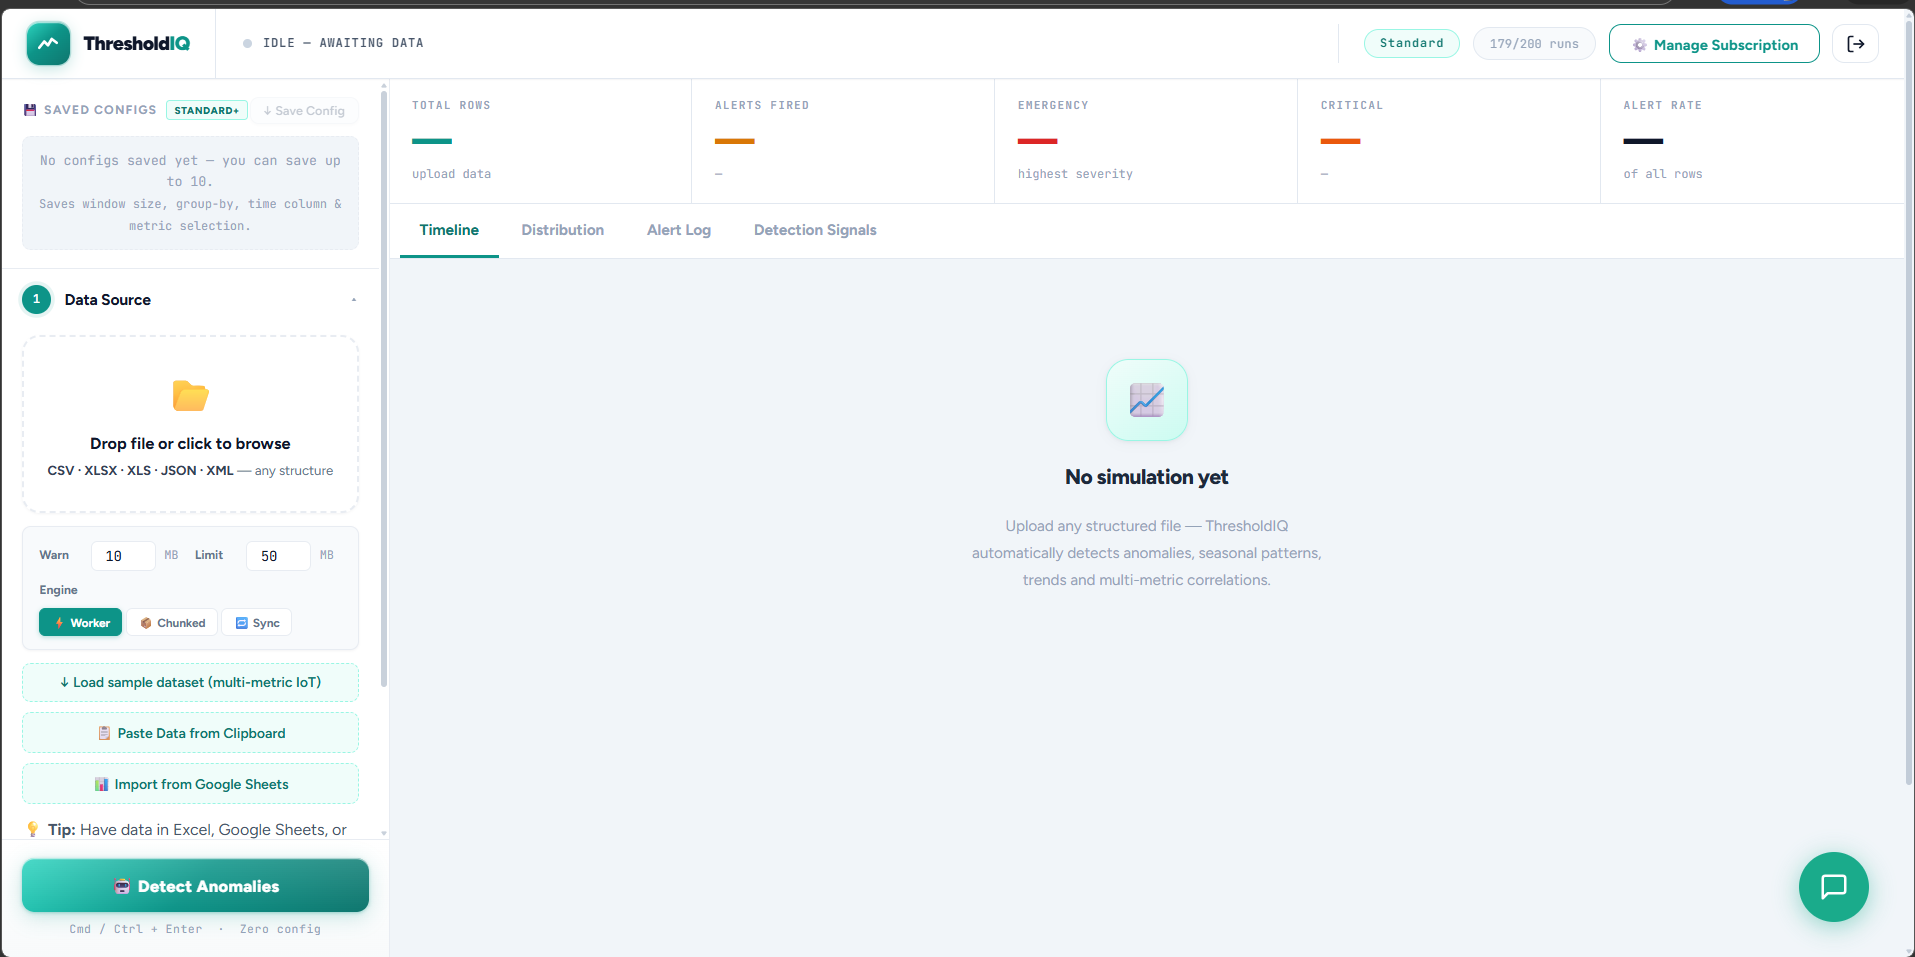
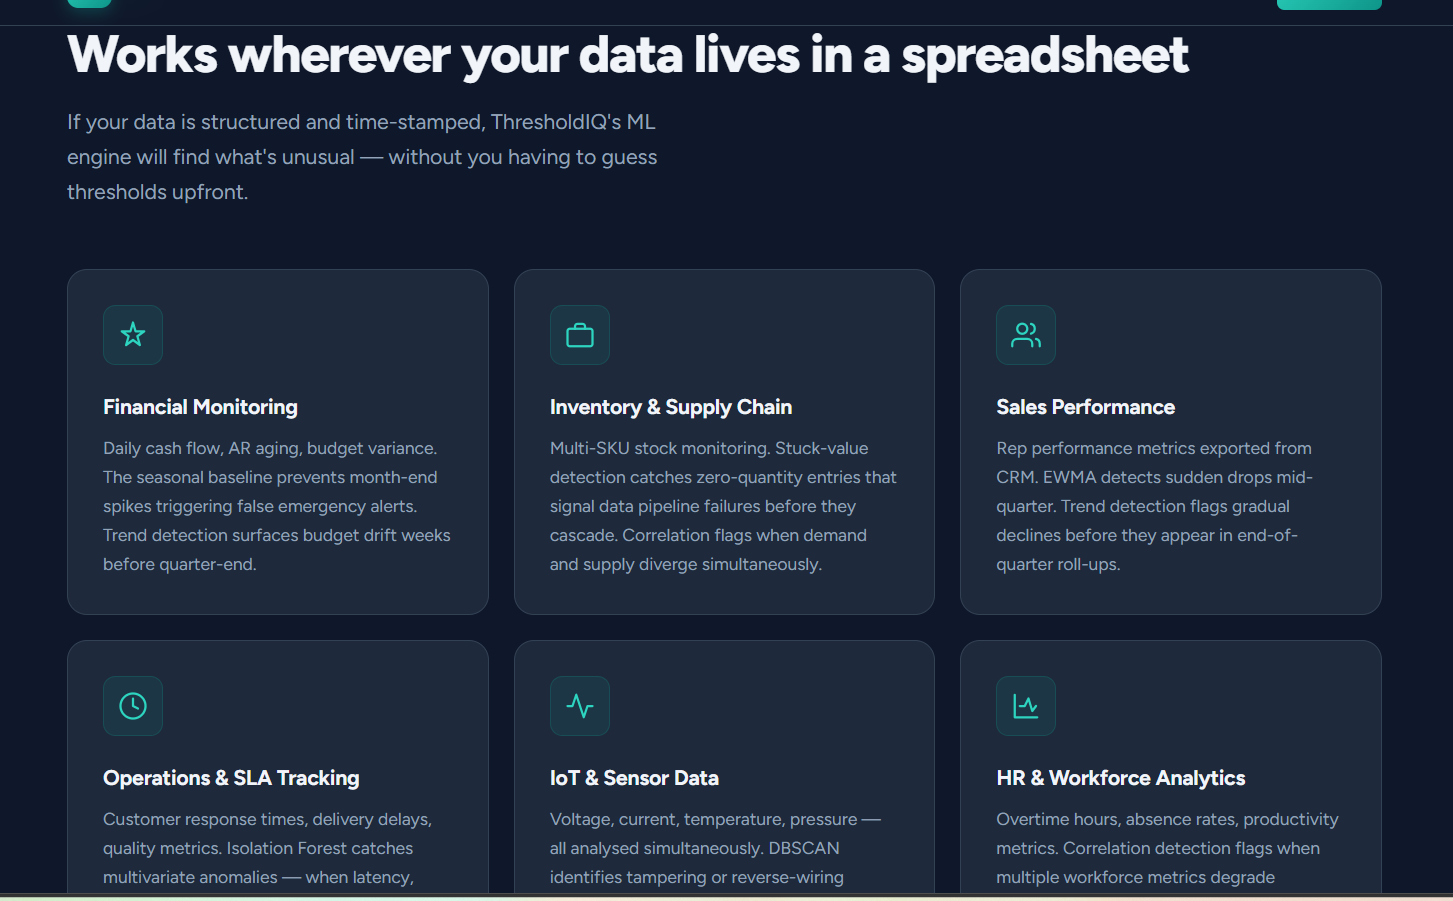
ThresholdIQ provides a no-code web platform for KPI monitoring and trend visualization by automating threshold classification across structured datasets. It bridges the gap between manual spreadsheet review and enterprise BI tools through lightweight, client-side data processing.

  • Supports diverse data formats including CSV, JSON, XML, Google Sheets, and direct table copy-pasting.
  • Ensures data privacy with 100% client-side browser processing that avoids data transmission or storage.
  • Eliminates manual rule configuration by utilizing 9 machine learning methods for automatic anomaly detection.
  • Handles high-volume data with support for up to 100,000 rows without requiring software installation.

Ideal for: Non-Technical Users, Data Scientists, and Product Managers who need to transform structured datasets into trend-focused dashboards for operations monitoring and KPI tracking.

Product Video

Screenshots

Screenshot 1 of ThresholdIQScreenshot 2 of ThresholdIQScreenshot 3 of ThresholdIQScreenshot 4 of ThresholdIQScreenshot 5 of ThresholdIQScreenshot 6 of ThresholdIQScreenshot 7 of ThresholdIQScreenshot 8 of ThresholdIQScreenshot 9 of ThresholdIQScreenshot 10 of ThresholdIQ

Product Updates (1)

VigneshJ
@VigneshJMar 16, 2026

ThresholdIQ 2.0

Few weeks ago, I shipped ThresholdIQ with a simple premise: monitor your spreadsheet data without needing a BI tool. You uploaded a file, set some threshold rules, and got email alerts when values crossed them. It worked. But users kept hitting the same wall: setting thresholds is harder than it sounds. What's the "right" threshold for revenue when your business has seasonality? What about a metric that's been quietly drifting for three months? So we scrapped the rule-based approach entirely. ThresholdIQ v2 uses 9 concurrent ML detection methods to find anomalies automatically — no thresholds to configure, no false positives from stale rules. What the engine actually does When you press Detect, the engine runs per group, per metric, per row — all inside your browser. Nine methods run in parallel: Multi-Window Z-score builds rolling baselines at four window sizes simultaneously. EWMA catches sudden deviations from exponential trends. SARIMA handles weekly and monthly seasonal patterns. Isolation Forest finds global outliers that local windows miss. Correlation deviation checks whether related metrics moved together. DBSCAN labels isolated noise points. The remaining three catch seasonal day/hour patterns, slow trend drift, and stuck or zero-value anomalies. Each method contributes a weighted score. The final severity — Warning, Critical, or Emergency — is determined by how many window tiers breach simultaneously. More windows breaching means a more persistent, significant anomaly. The window control actually works now The sidebar has always had a 50 / 100 / 200 / 500 pts window selector. In v1 it only changed the chart viewport. In v2, it scales all four detection window sizes proportionally. Choose 50 pts and the engine uses windows of [25, 50, 100, 250] — reactive, catches fast spikes. Choose 500 pts and it uses [250, 500, 1000, 2500] — stable, only flags
Product had at the time: 1 upvotes • 1 comments • 1 followers • 1 PeerPush

Comments (3)

alcazarsec
@alcazarsecMar 18, 2026

It sounds like v2 has a much better UI/UX. Kudos!

VigneshJ
@VigneshJMar 19, 2026

@alcazarsec Thanks a lot

wafler
@waflerMar 17, 2026

Great stuff - the team is clearly committed.

VigneshJ
@VigneshJMar 17, 2026

@wafler Thanks a lot, it was after clear struggles i have seen with team by manually scanning excel and finding the anamolies.

D

cool

VigneshJ
@VigneshJMar 17, 2026

@devashishshukla0007 , Thanks , Please try and let me know

D

@VigneshJ thanks

Reviews (0)

No reviews yet. Be the first to rate this product!

Comments (5)

alcazarsec
@alcazarsecMar 18, 2026

Who do you think your competitors are?

VigneshJ
@VigneshJMar 19, 2026

@alcazarsec Hi, specifically we dont have many tool that detects the business data and raise anomalies, It is similar to Datadog,New Relic These monitor systems, not business data. “They monitor servers. We monitor business"

wafler
@waflerMar 17, 2026

Love that you shipped this before it was perfect. And if you ever need DDoS protection with a proper firewall for your website, just let us know!

VigneshJ
@VigneshJMar 17, 2026

@wafler Thanks, will let you know

exposure
@exposureMar 17, 2026

Great stuff, congrats.

VigneshJ
@VigneshJMar 17, 2026

@exposure Thanks a lot, Please try and provide me the feedback

hukt_ai
@hukt_aiMar 17, 2026

Cool! Thanks for sharing!

VigneshJ
@VigneshJMar 17, 2026

@jenezis Thanks, please do try and let me know the feedback.

VigneshJ
@VigneshJFeb 23, 2026

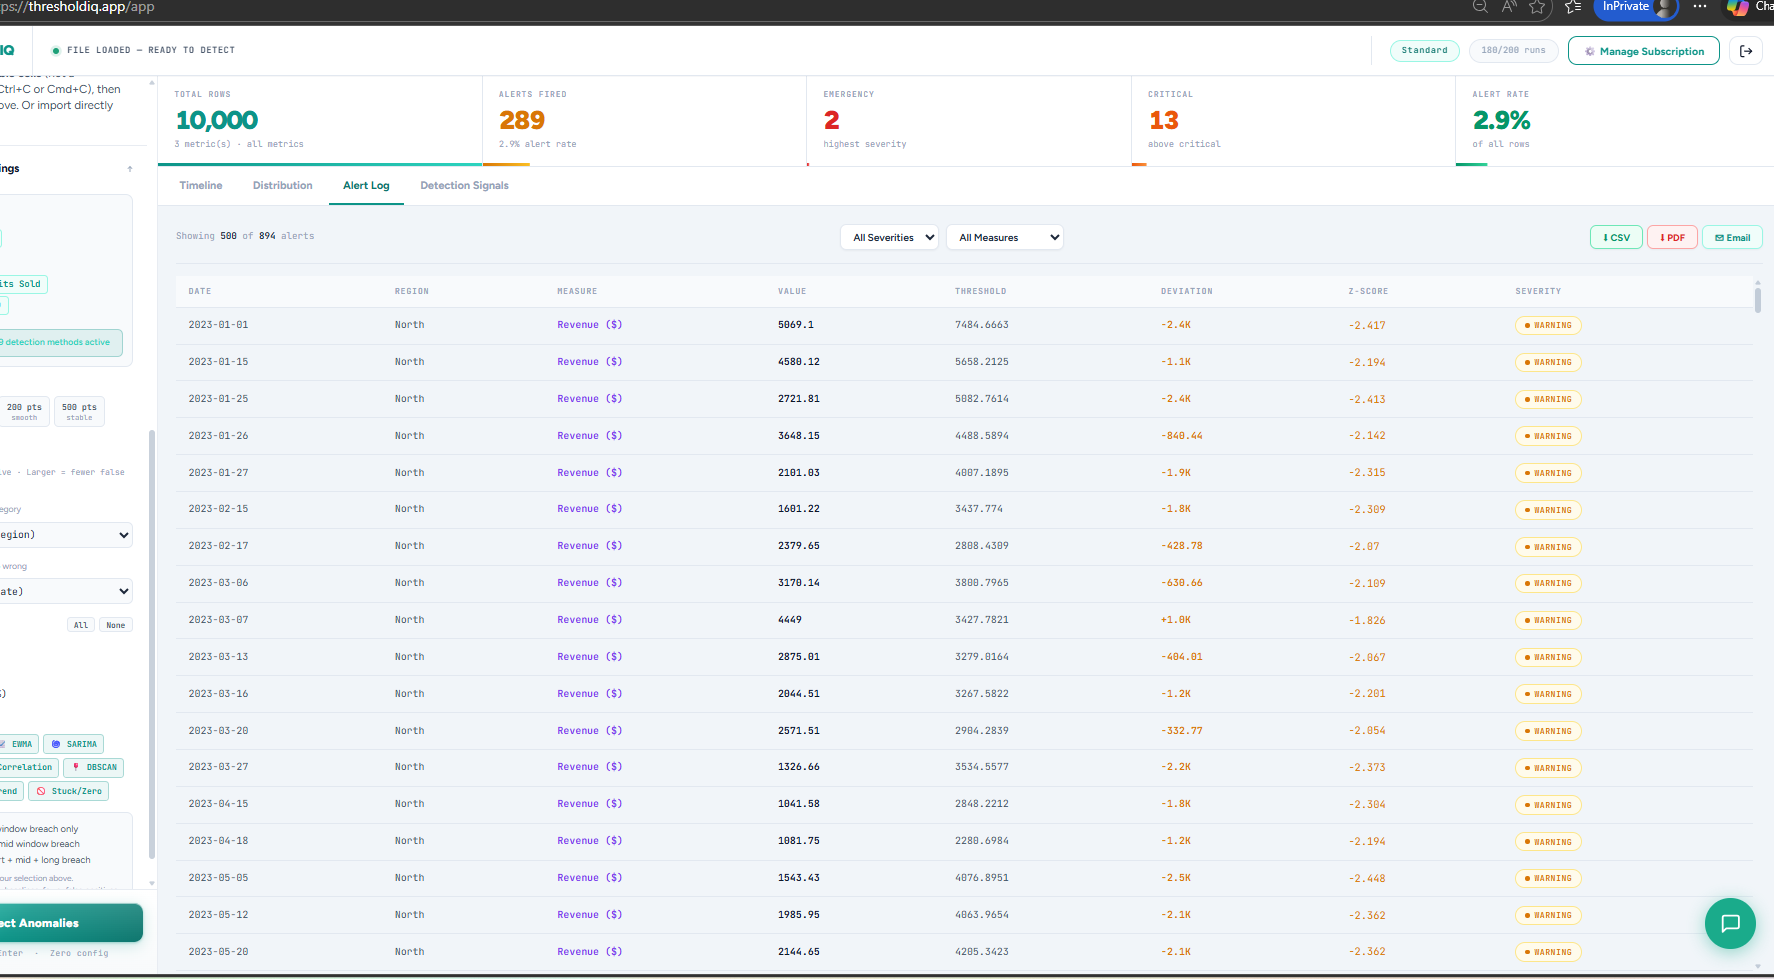
Turn any spreadsheet into critical, warning & emergency insights. Stop manually scanning spreadsheets — get instant alert dashboards. Spreadsheet data. Instant alerts. No BI tools needed.