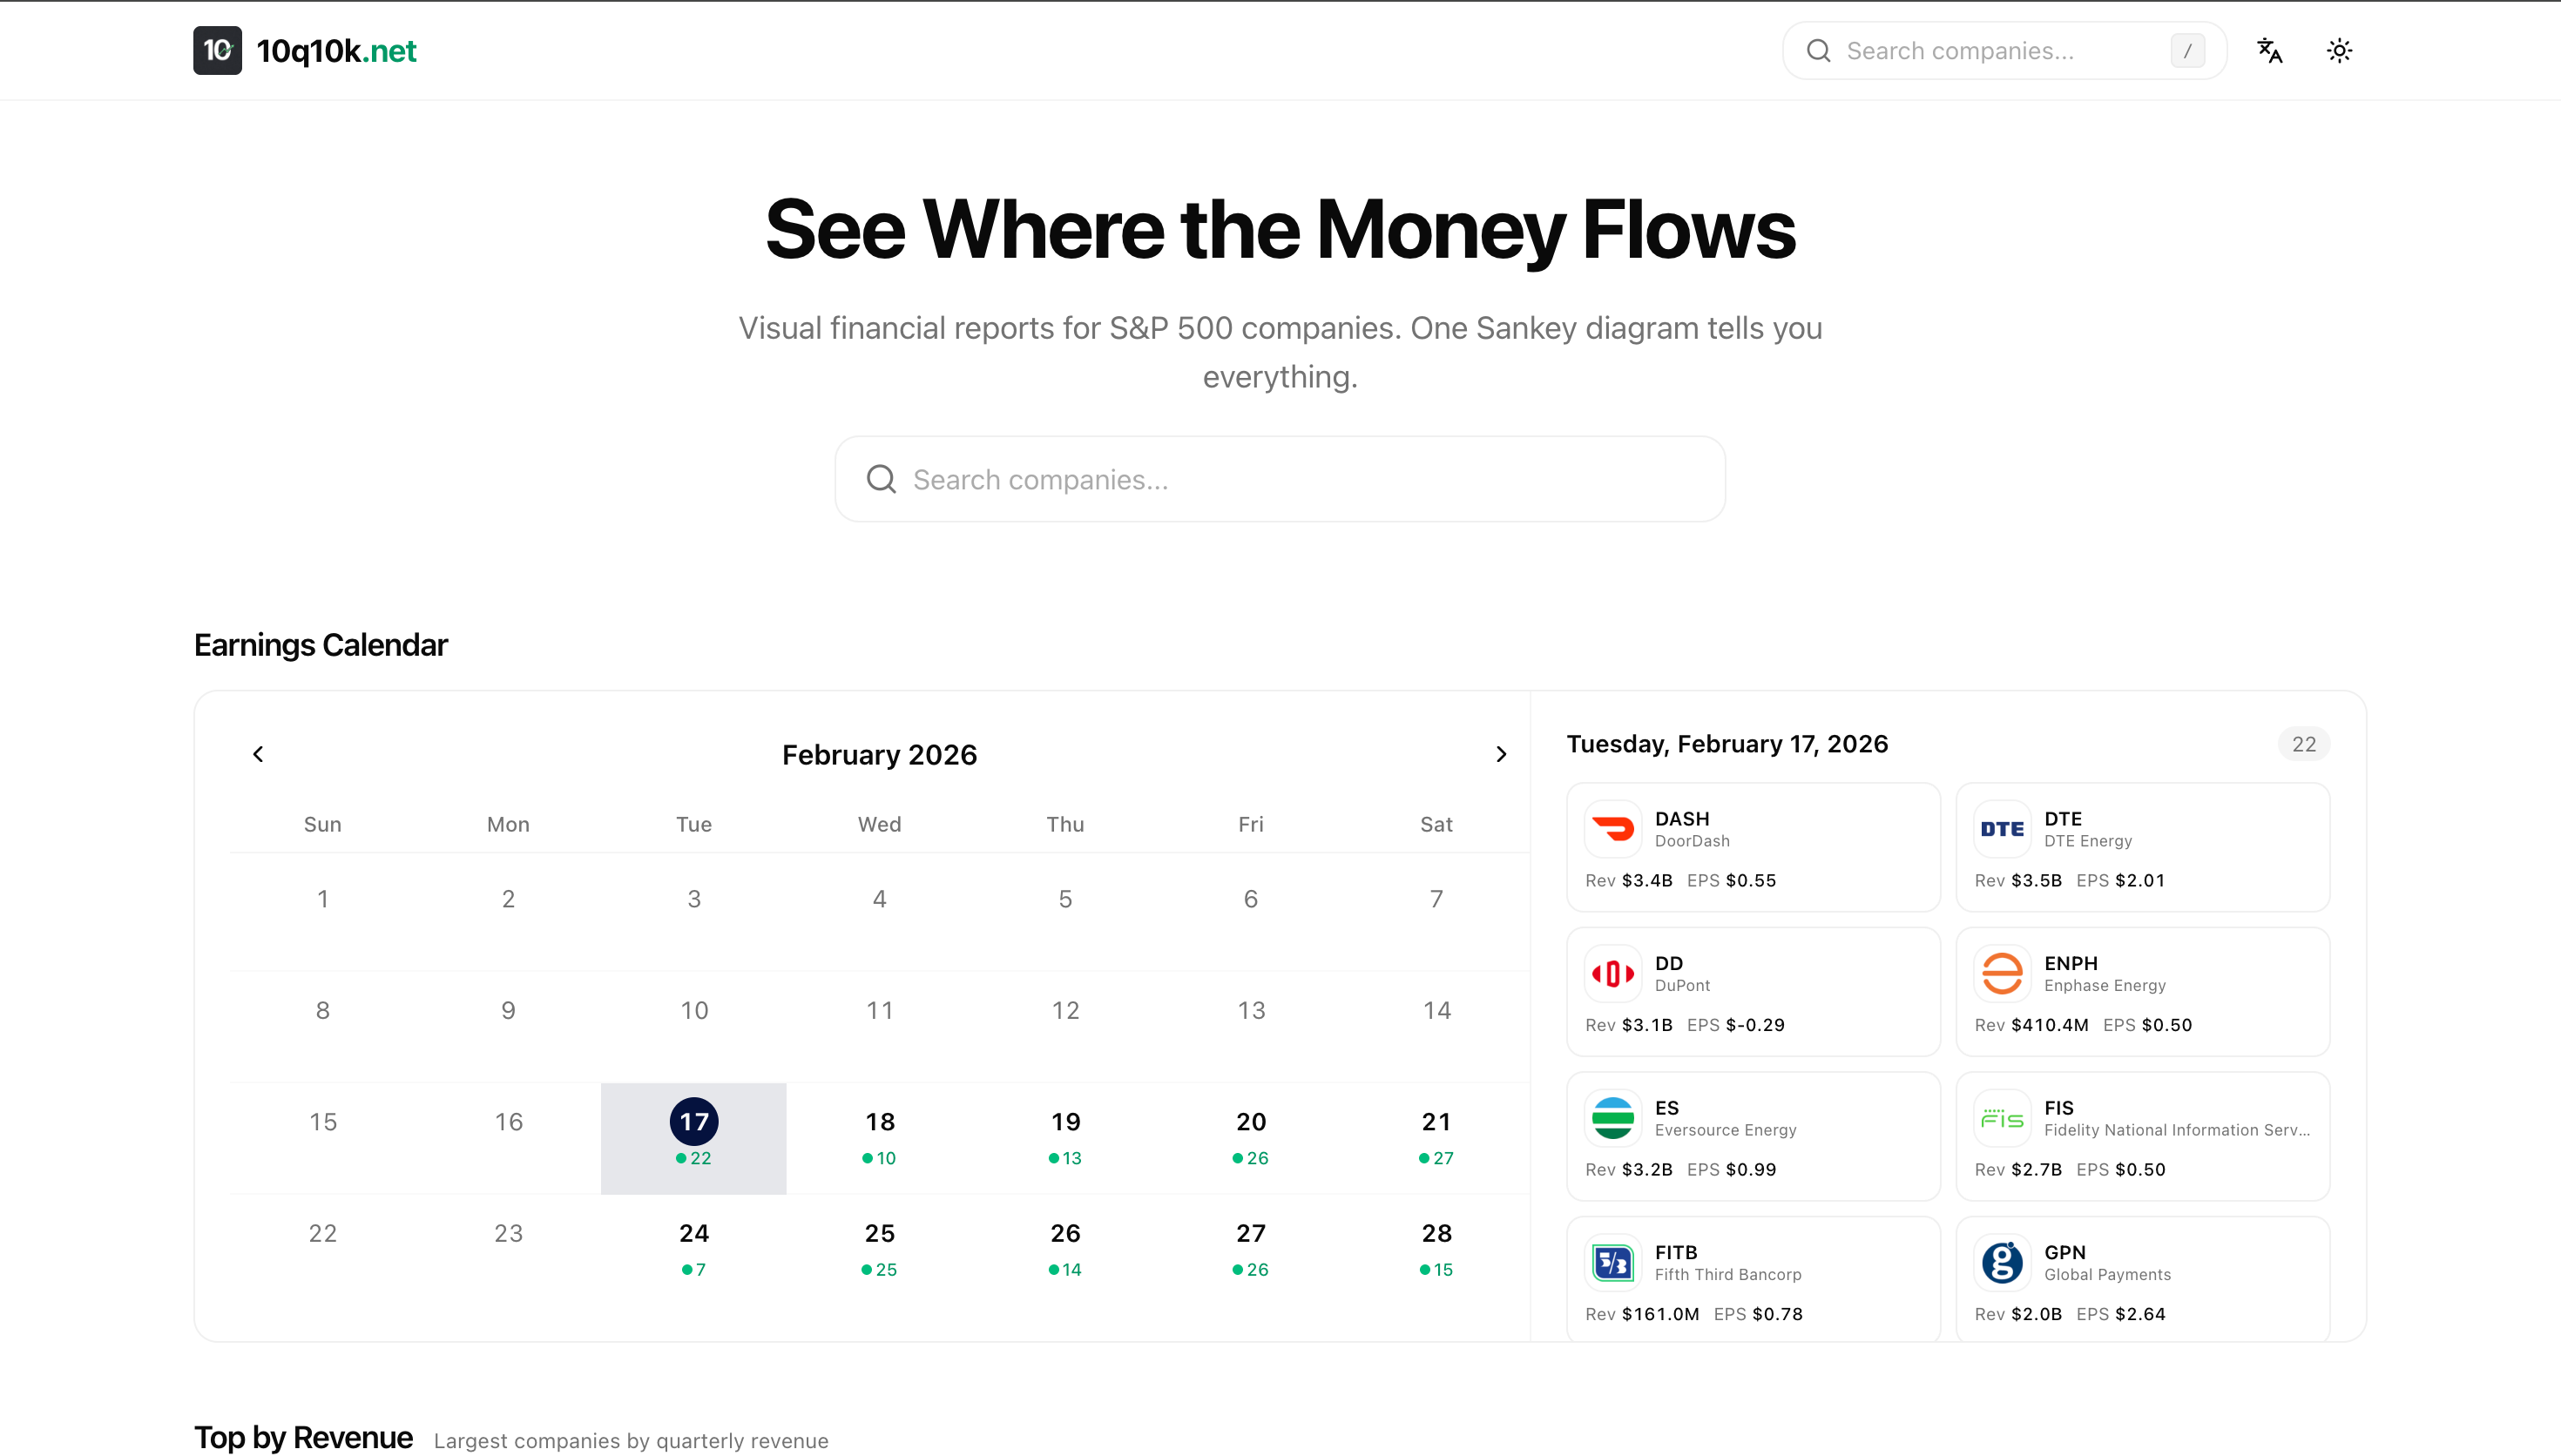
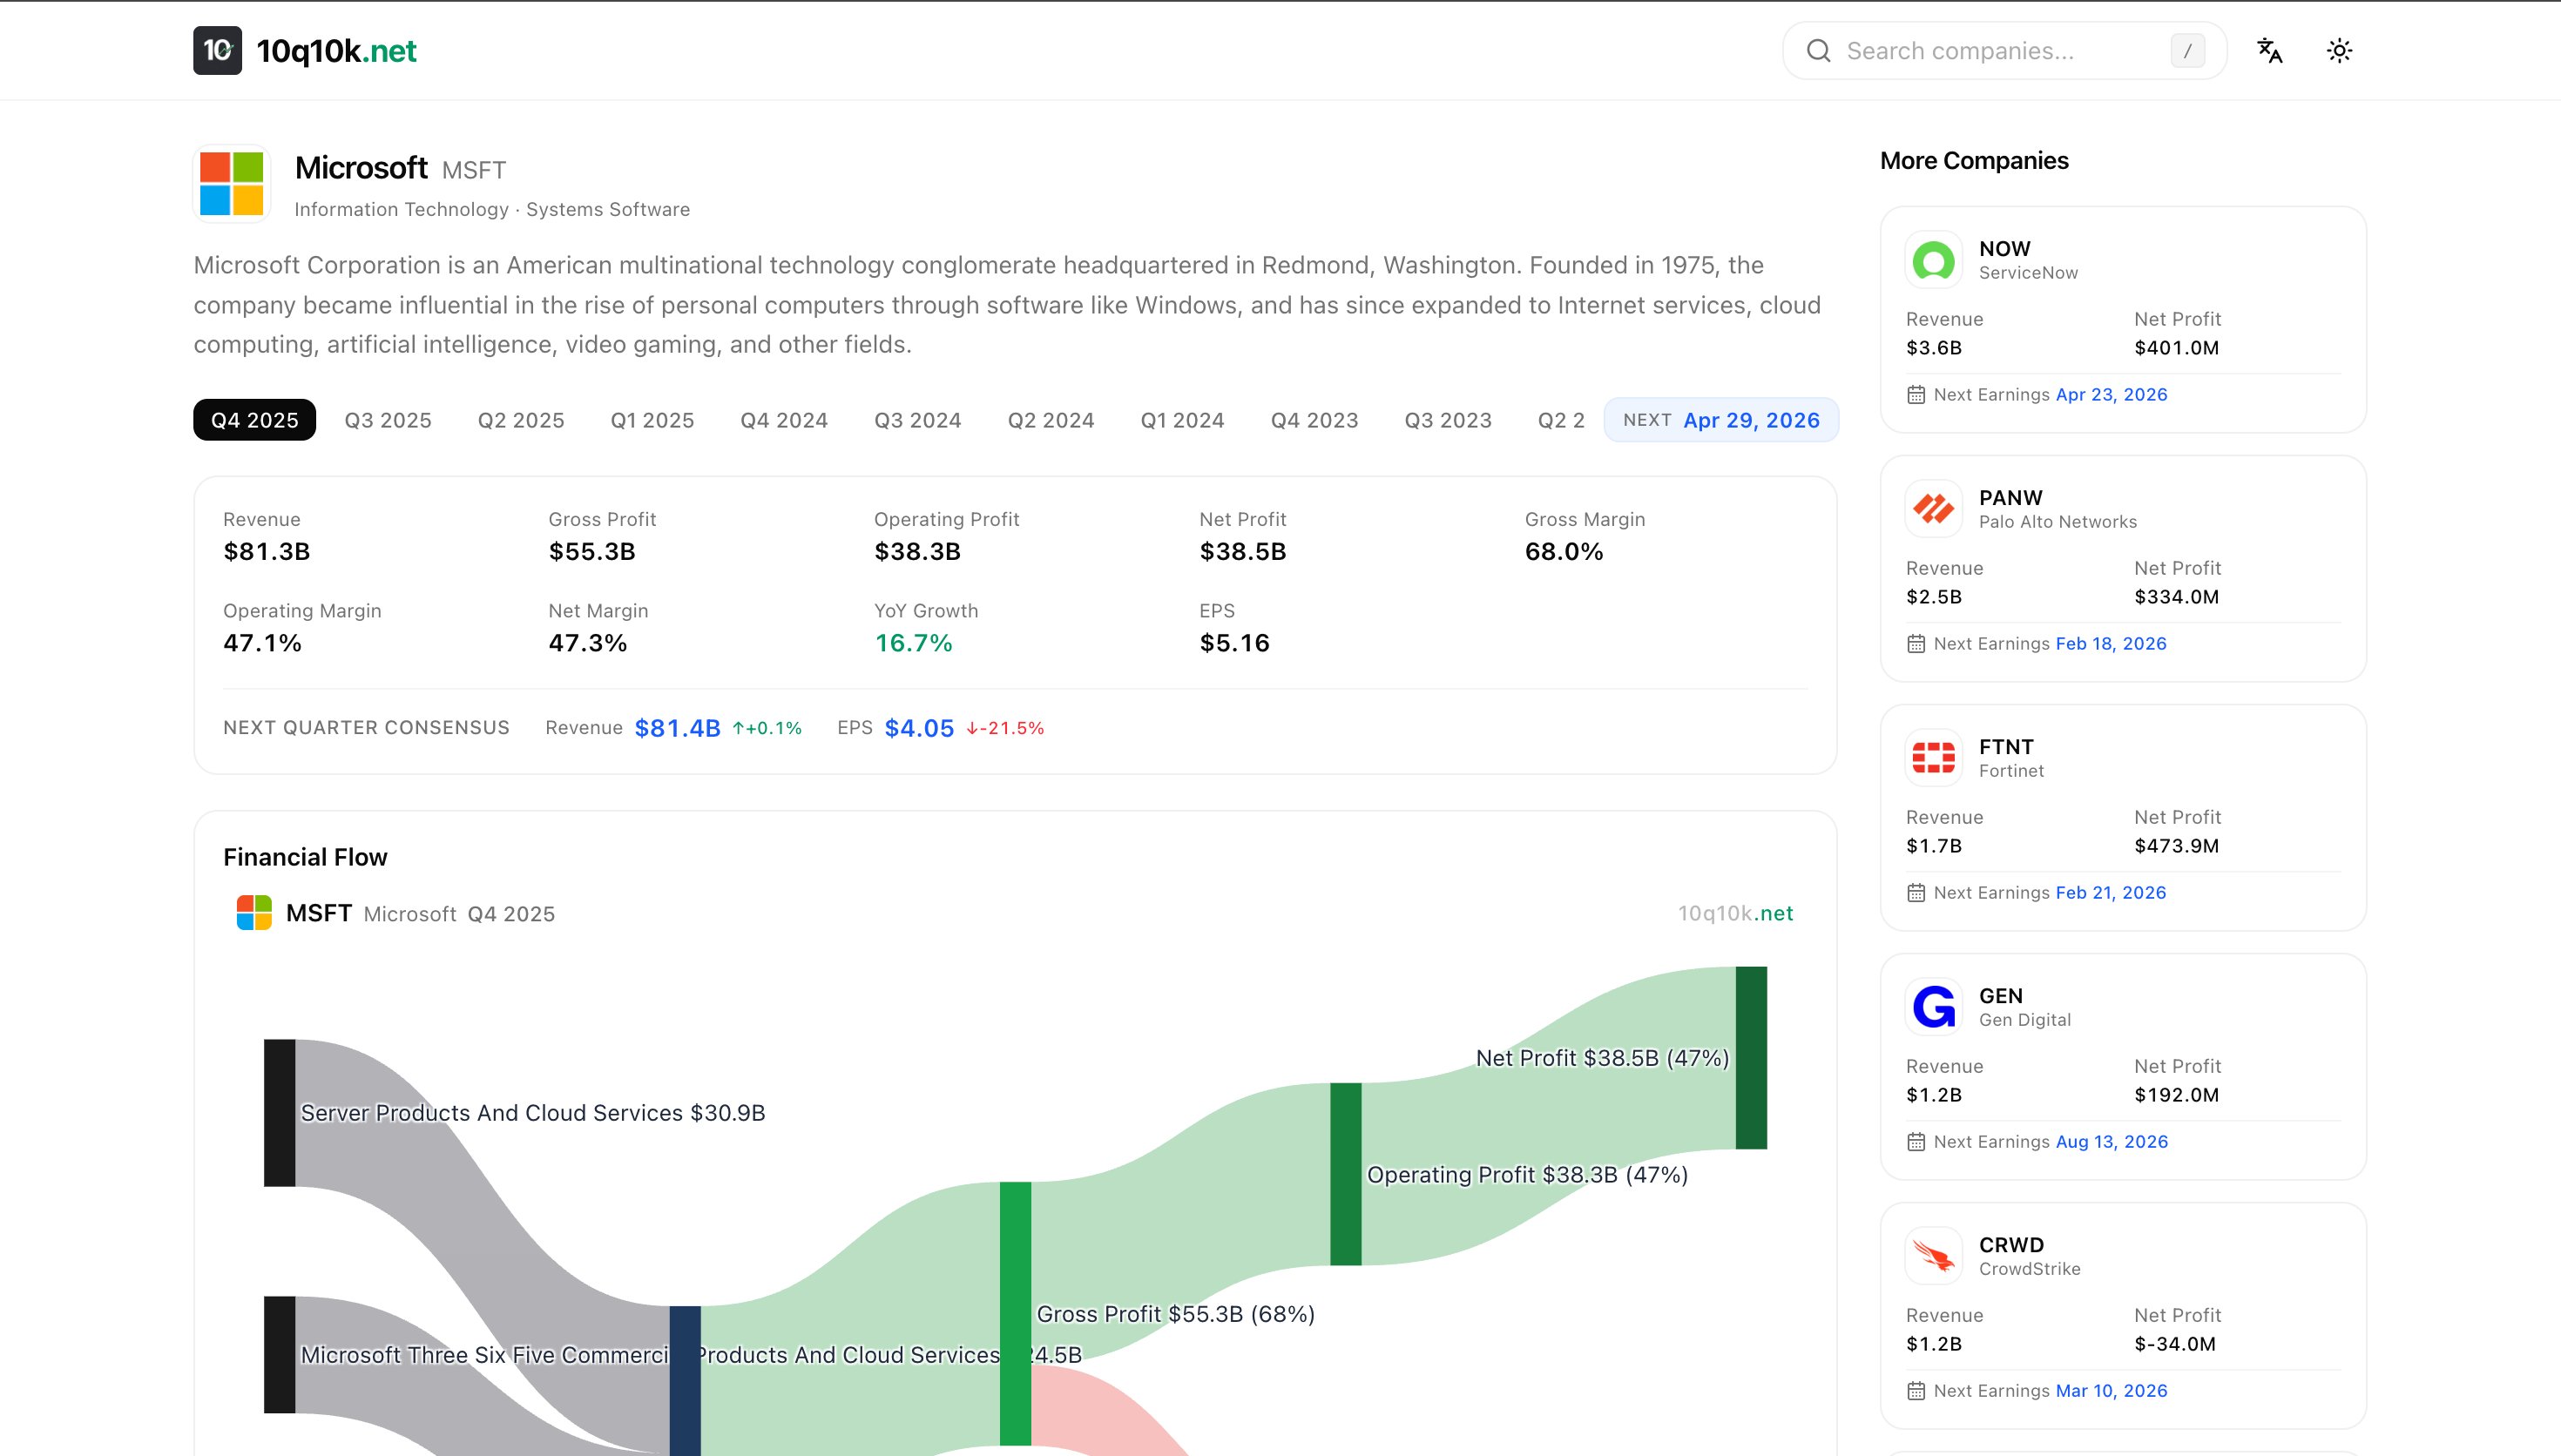
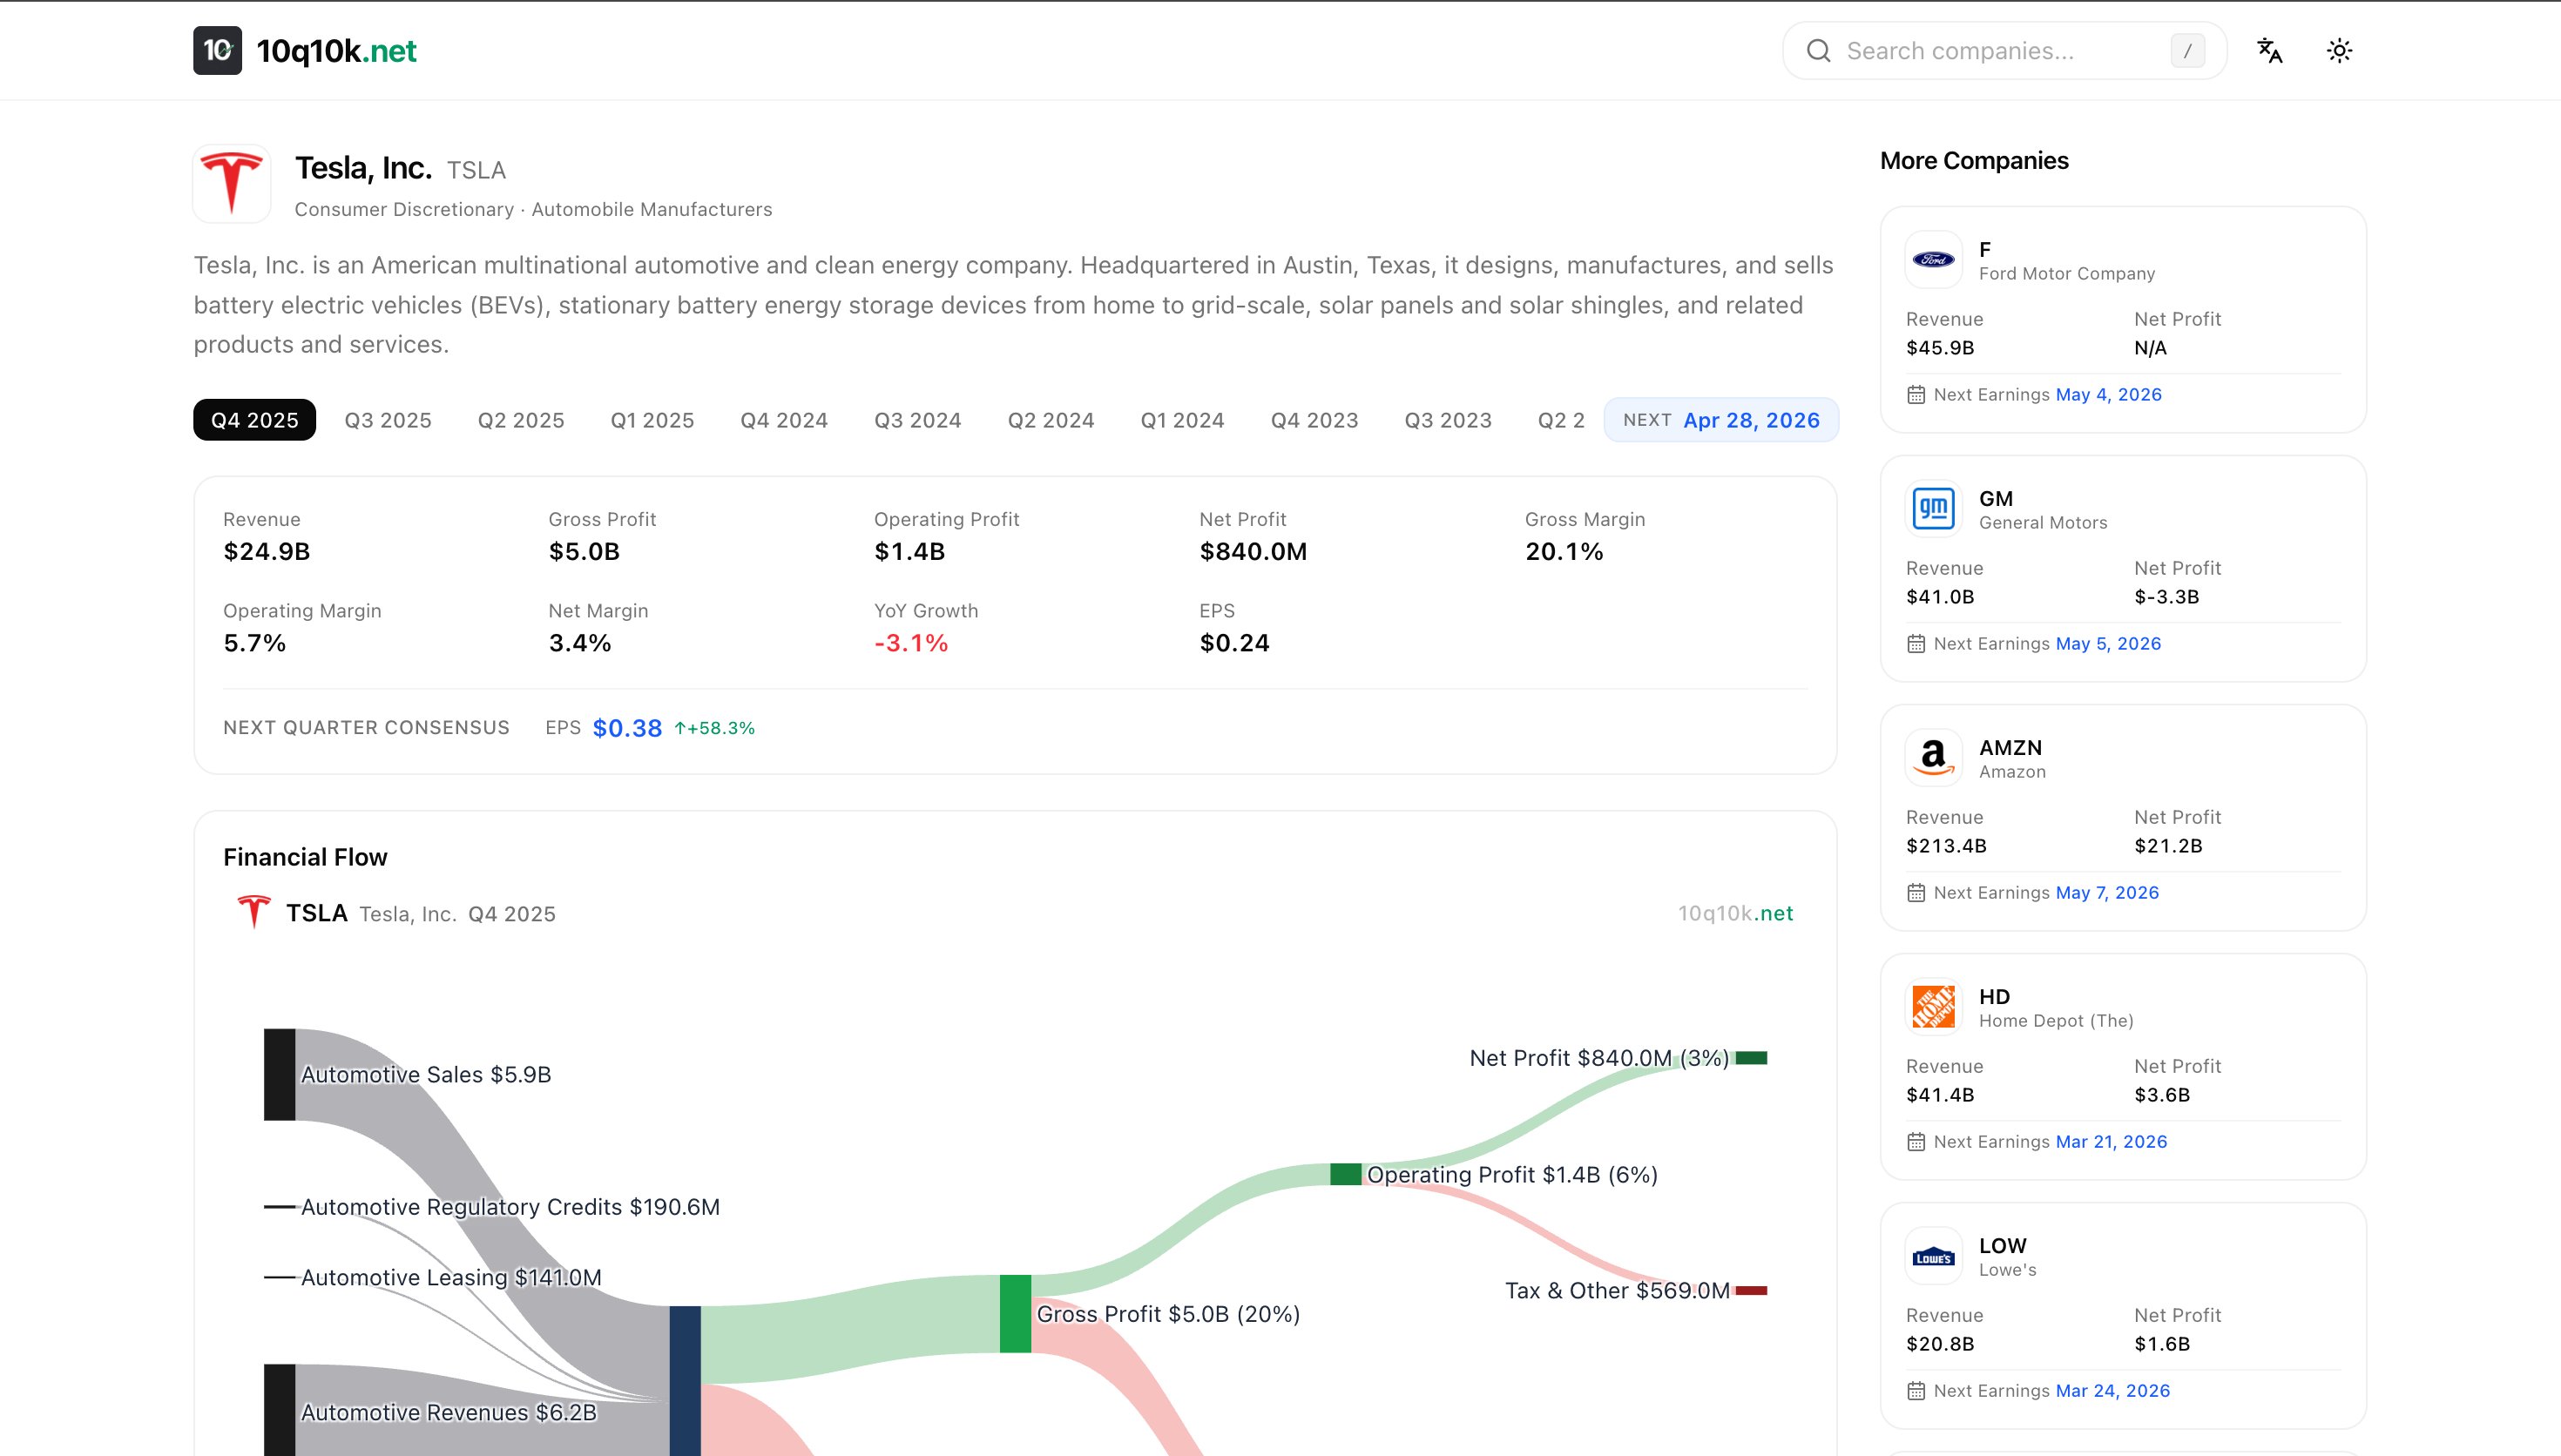
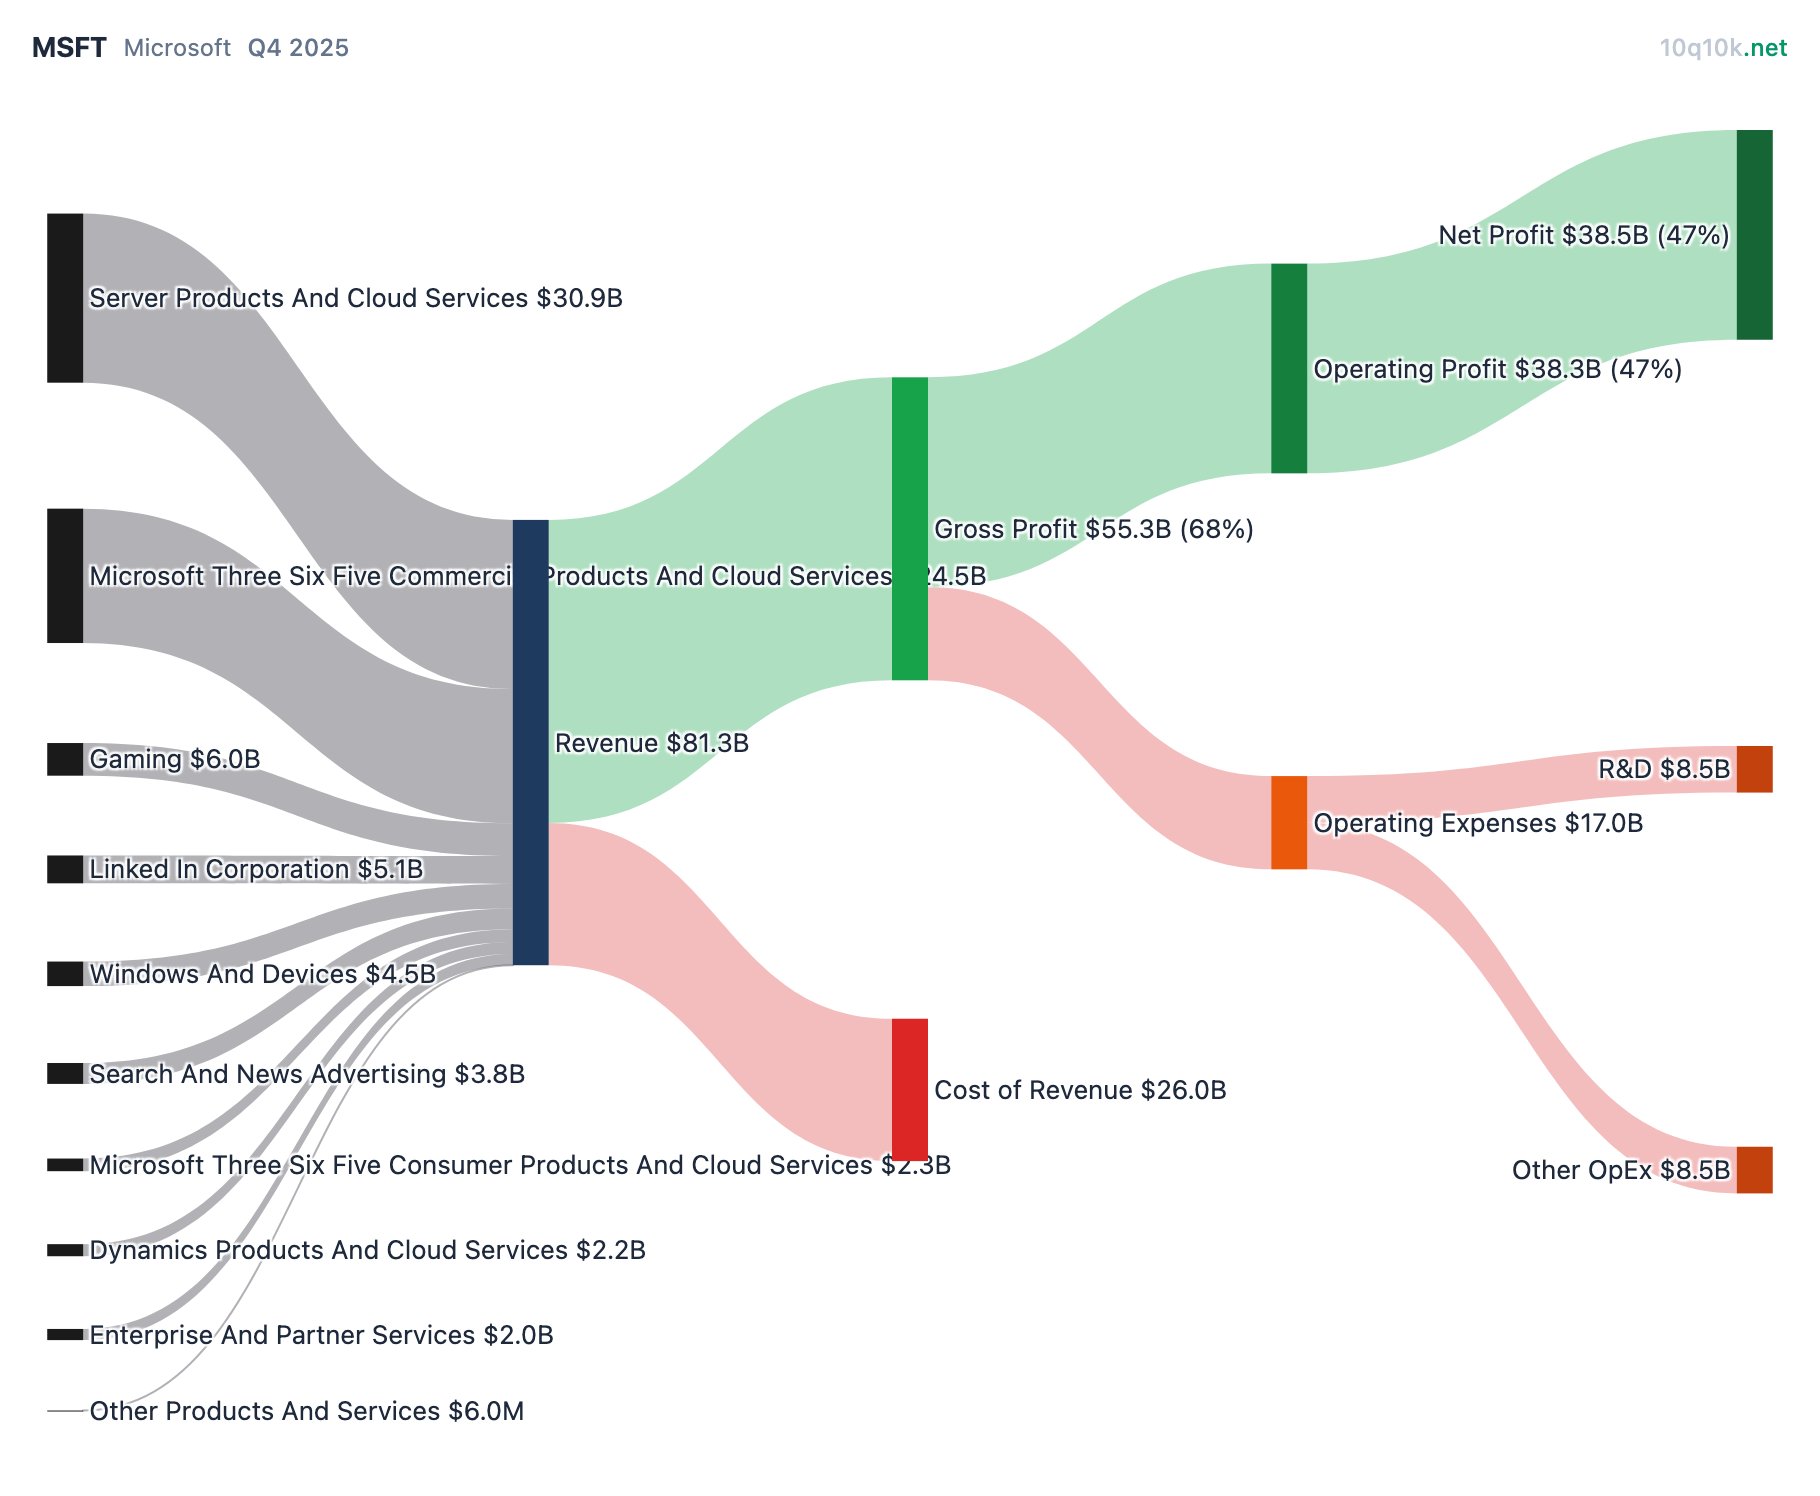
You can transform complex financial data into clear, visual representations. This platform provides visual financial reports for US stocks, allowing you to see exactly where money comes from and where it goes using intuitive Sankey diagrams. It simplifies the analysis of 10-Q and 10-K filings, helping you better understand the revenue and expense structures of publicly traded companies.


Comments (1)
cool