AntForms
Free Forms. Unlimited Responses. Real Analytics.

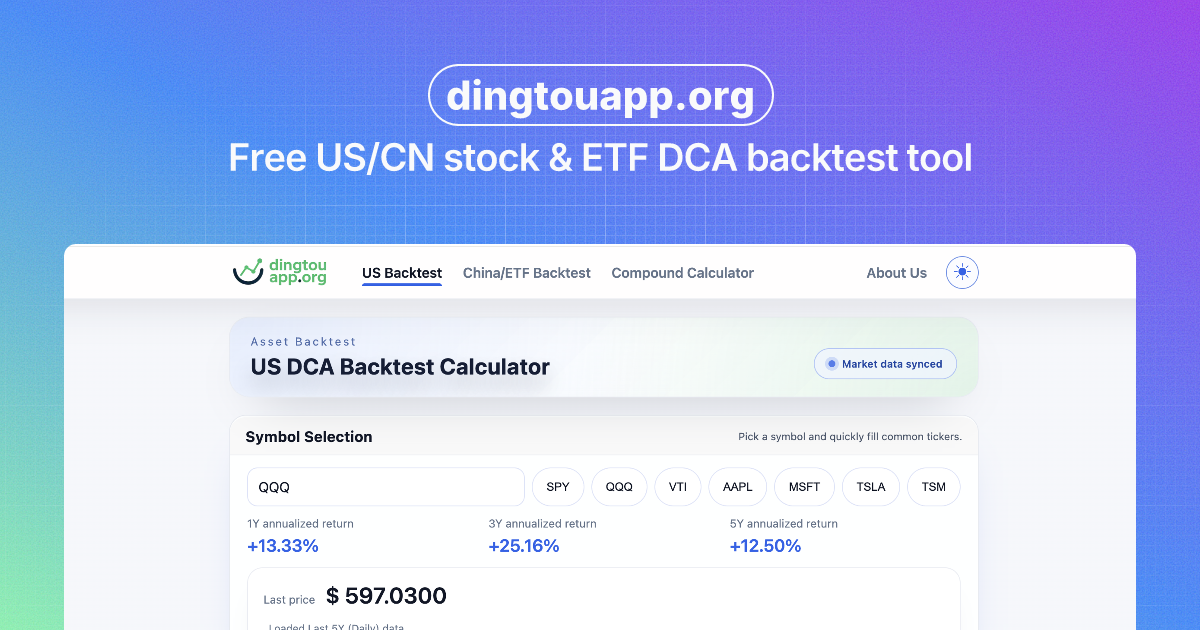
Backtest DCA and compounding growth for US stocks and ETFs

This web-based analytics tool provides backtesting simulations for US stocks and ETFs, specifically focusing on Dollar Cost Averaging and compounding growth strategies. It enables users to visualize long-term investment outcomes using historical ticker data through interactive charts.
Ideal for: Non-technical users, founders, and solopreneurs who need to analyze historical investment performance for US equities using DCA strategies.
No updates yet. Check back later for updates from the team.
No reviews yet. Be the first to rate this product!
Comments (0)
No comments yet. Be the first to share your thoughts!