
FableSense AI
AI-powered qualitative coding and data visualization

Details
- Follow on
- @fablesenseaiLinkedIn
- Target Audience
- UX ResearchersStudentsData Scientists
- Platforms
- Web
About FableSense AI
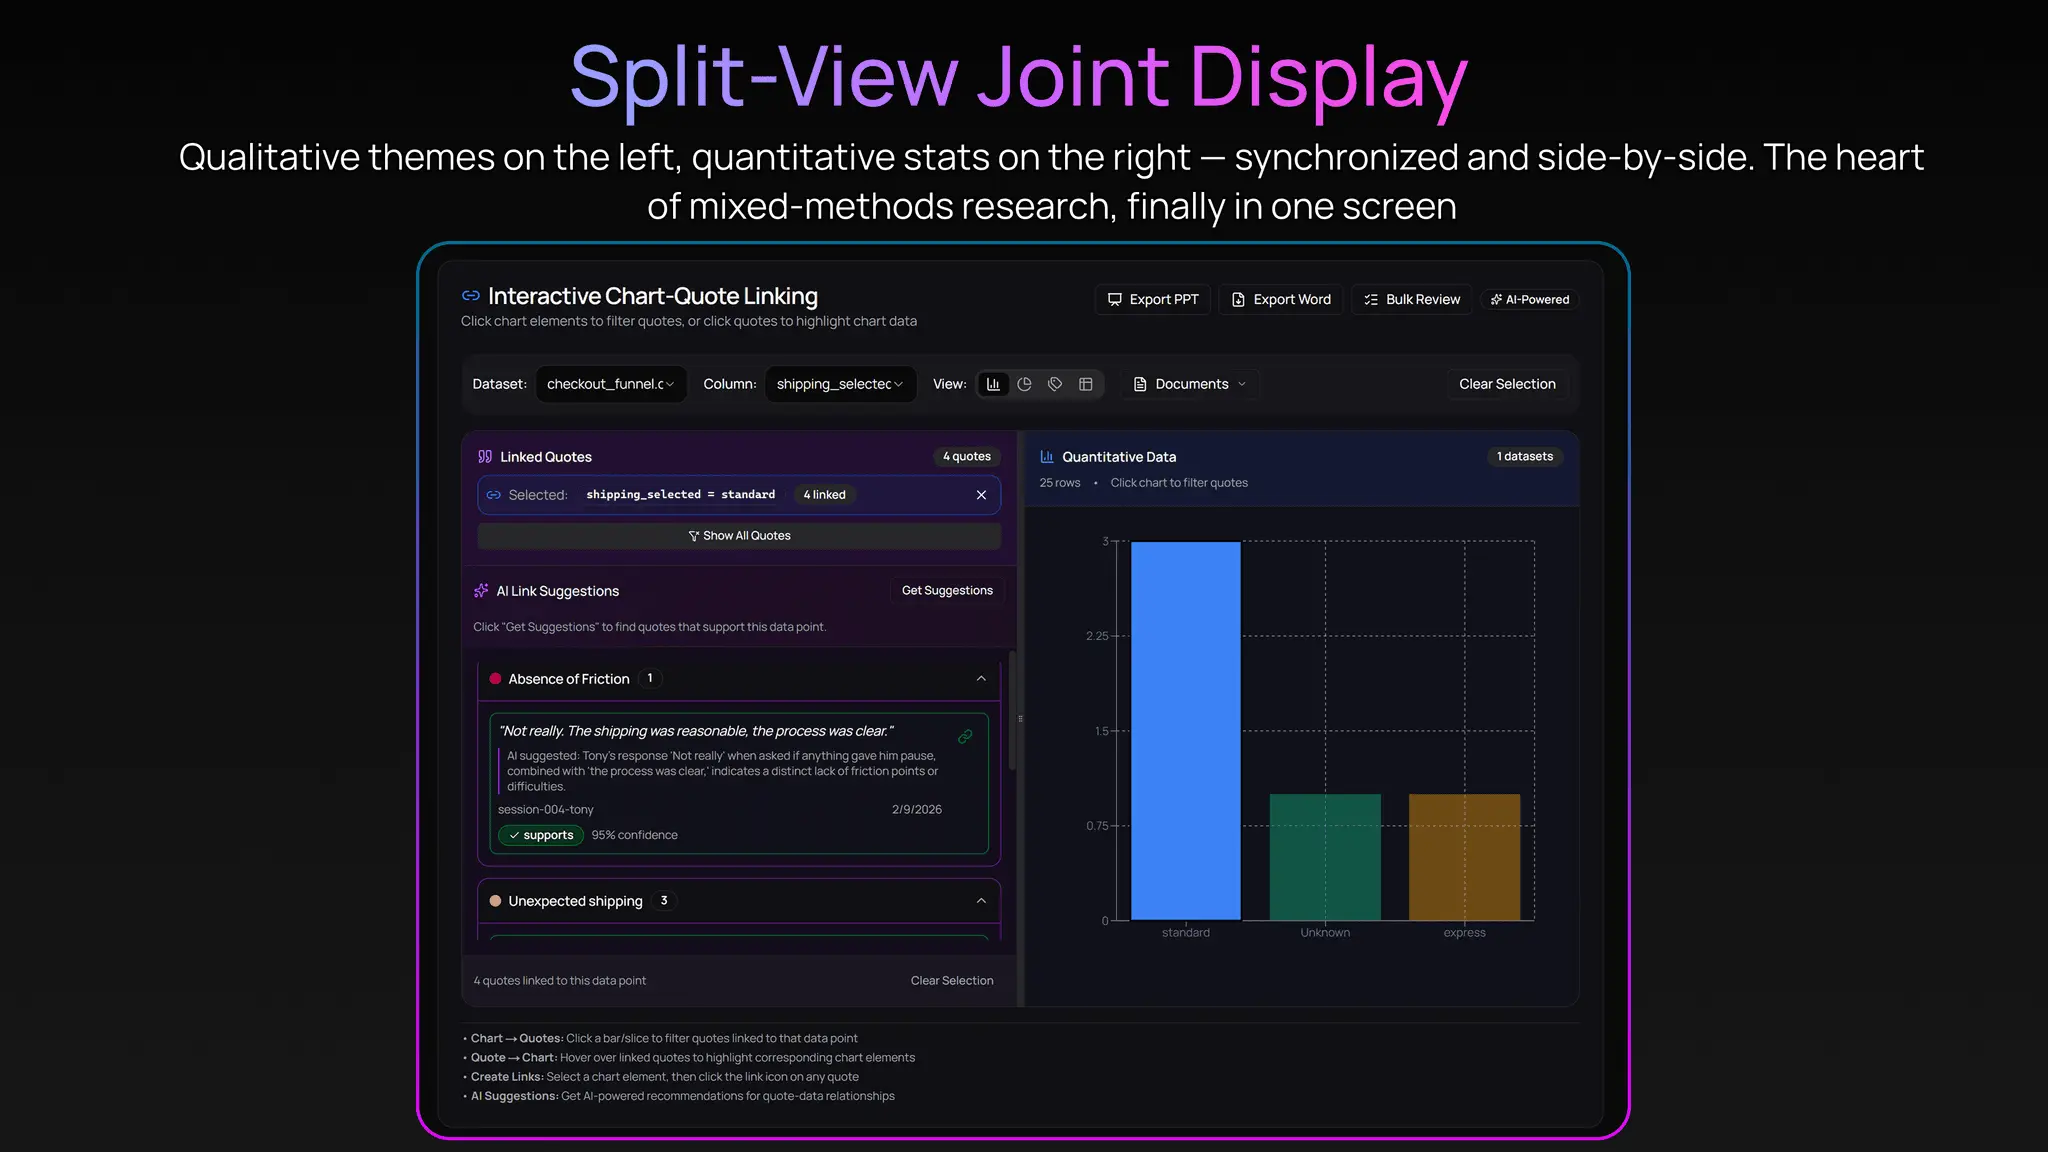
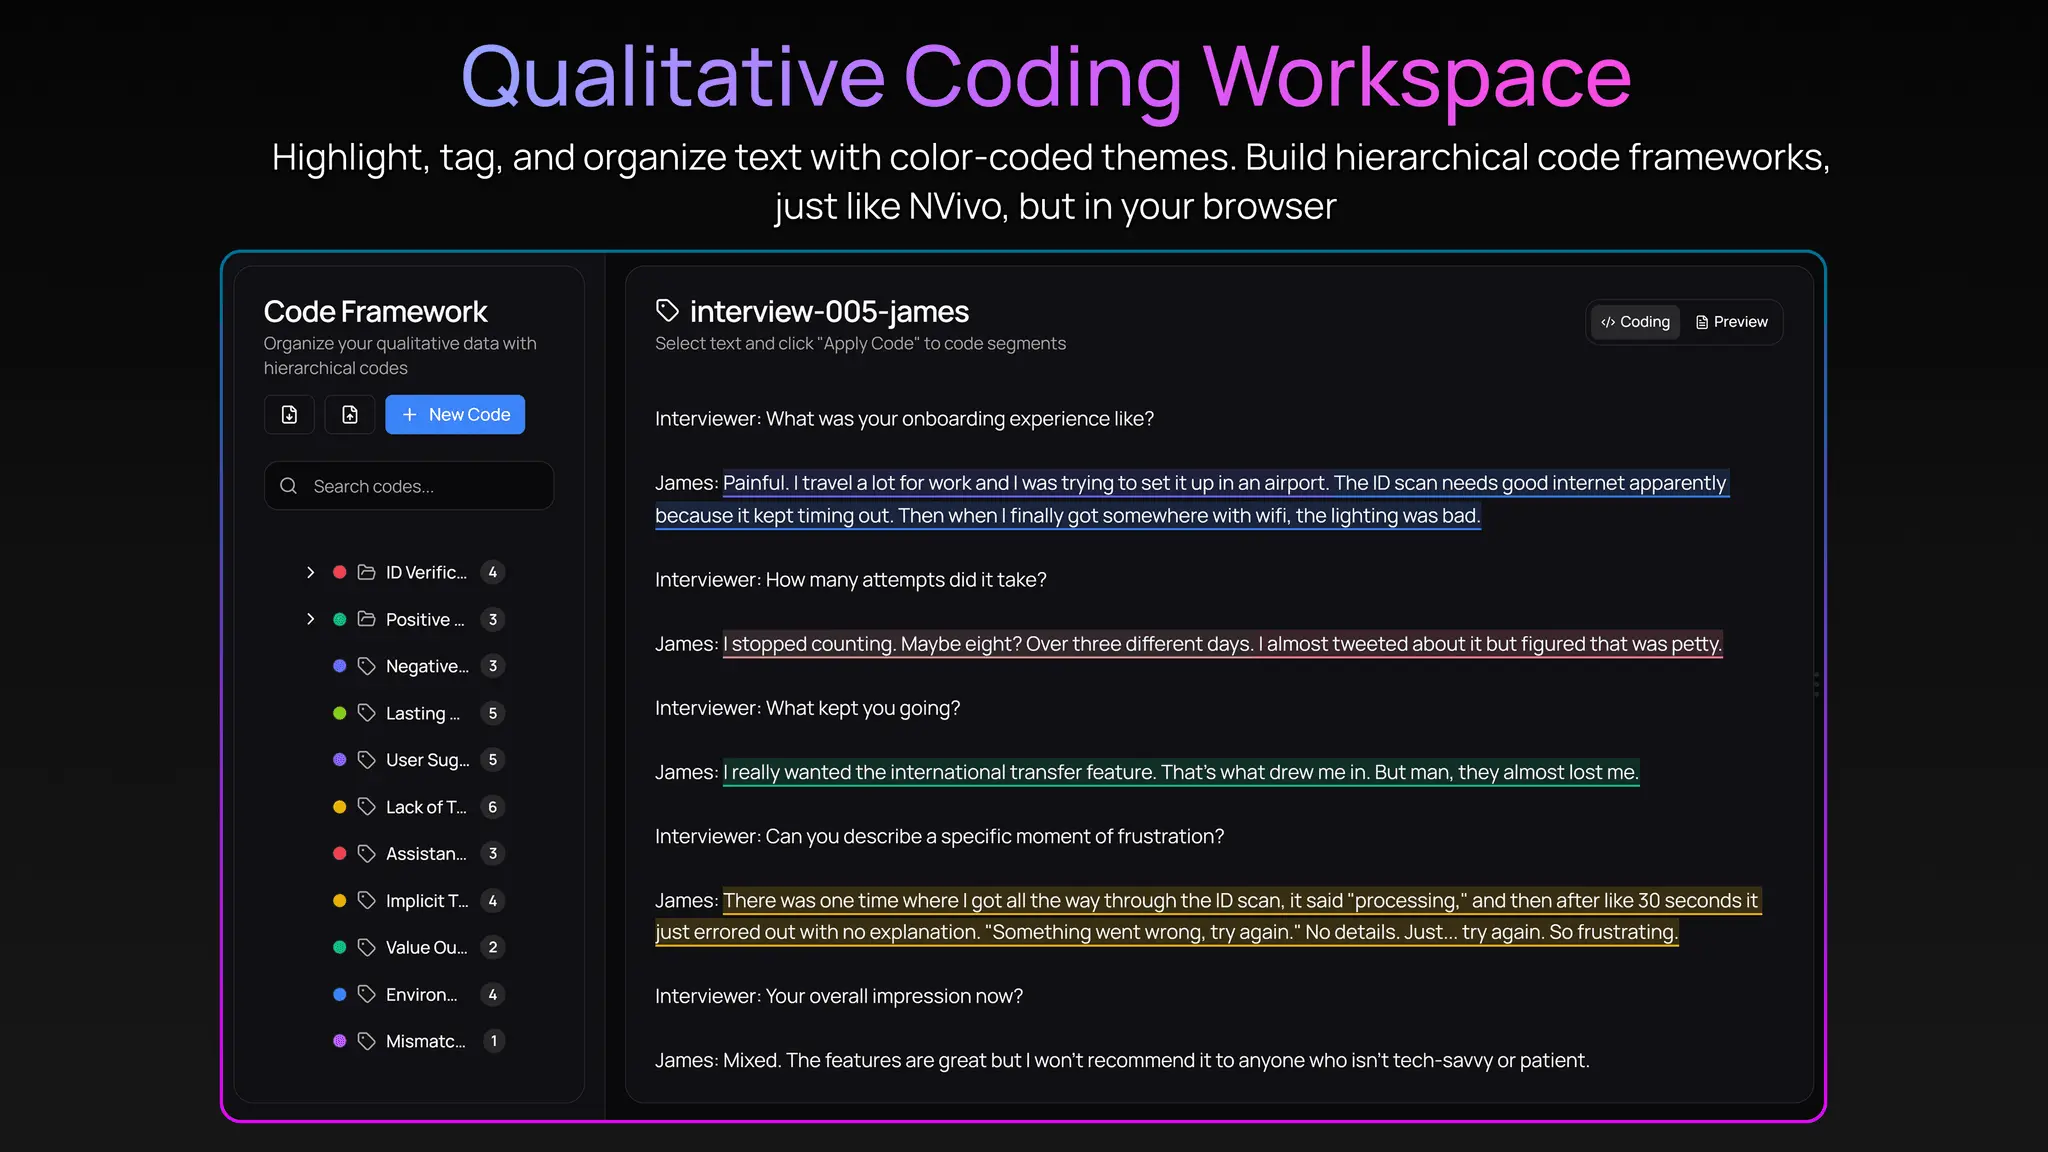
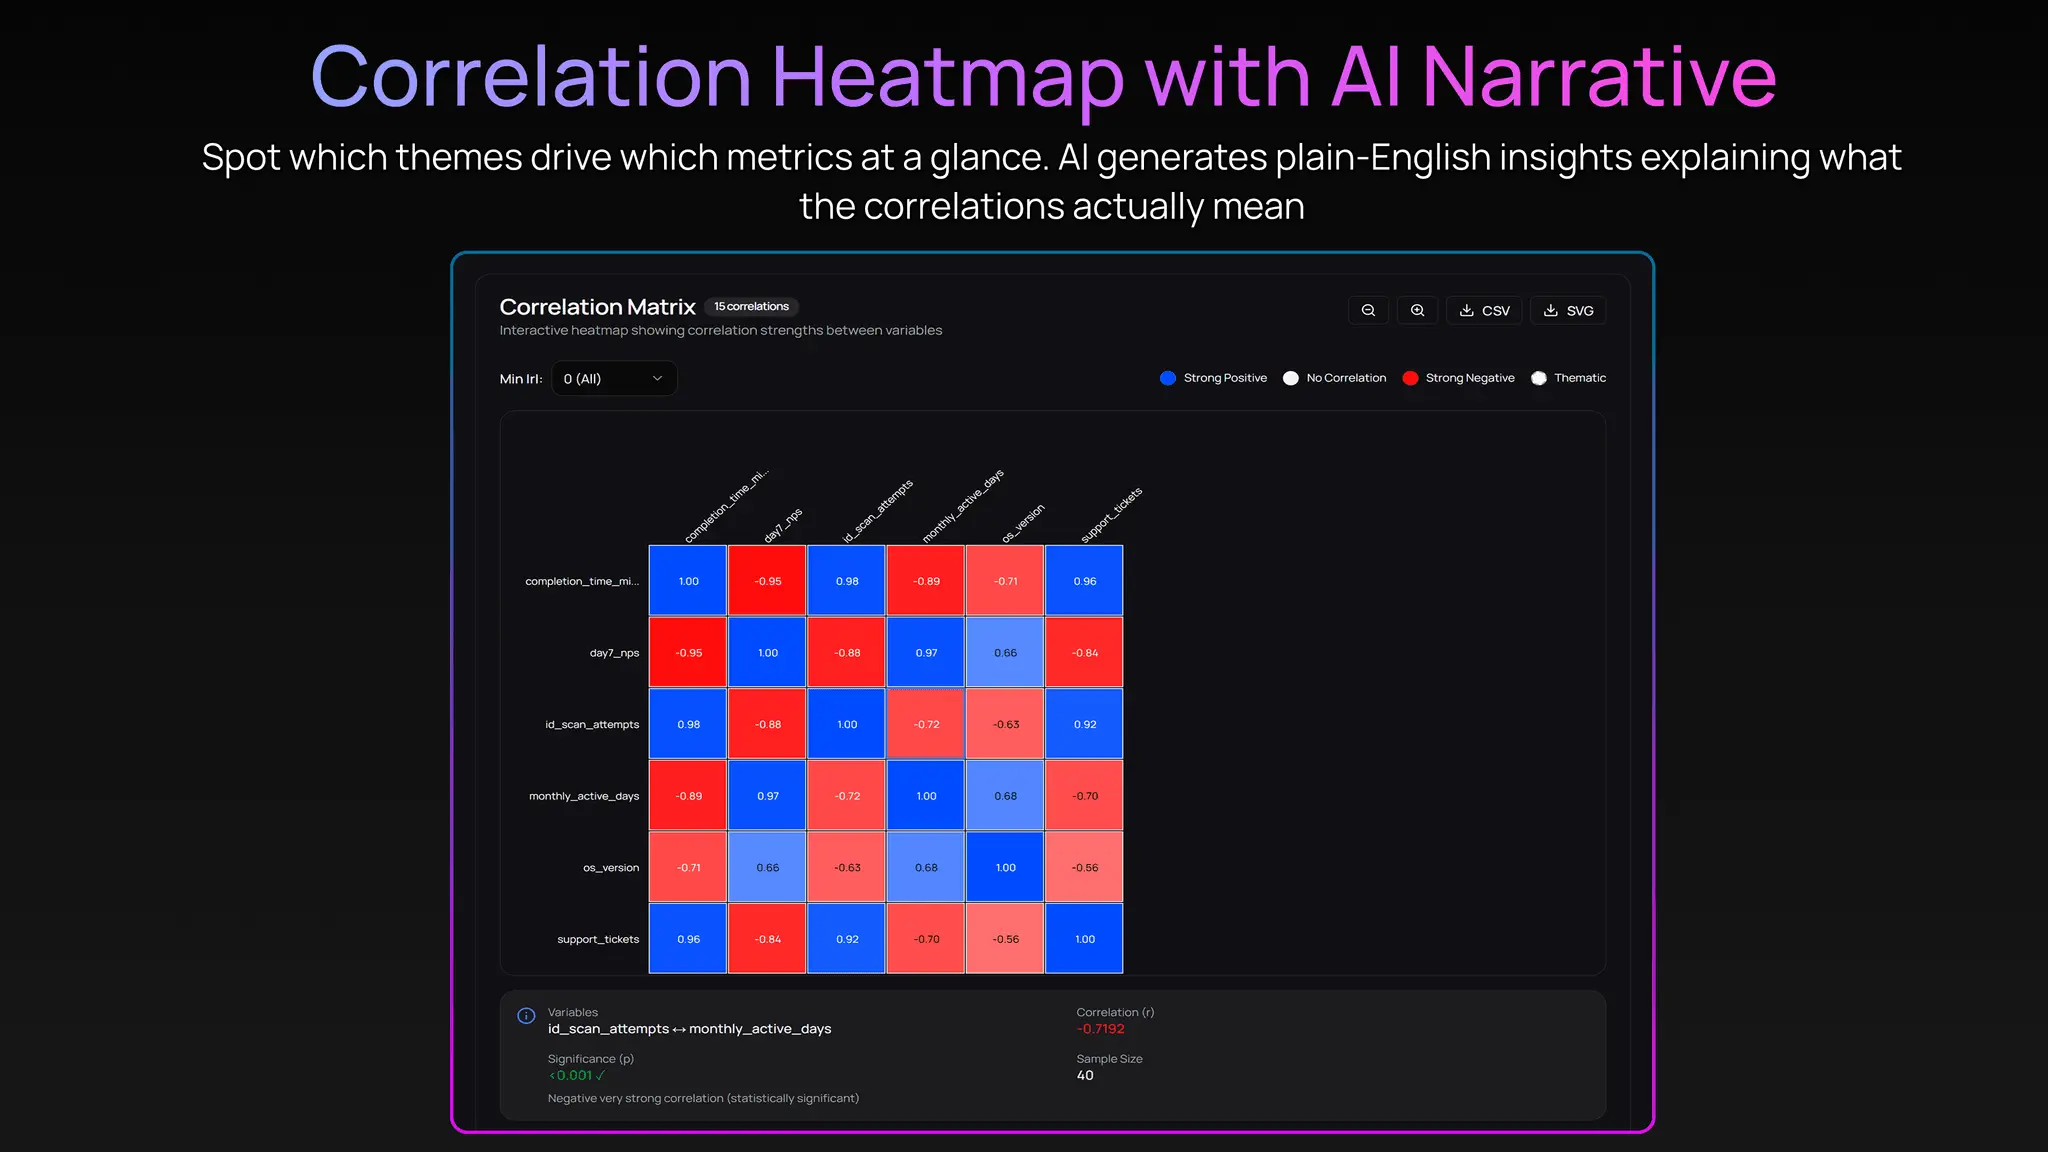
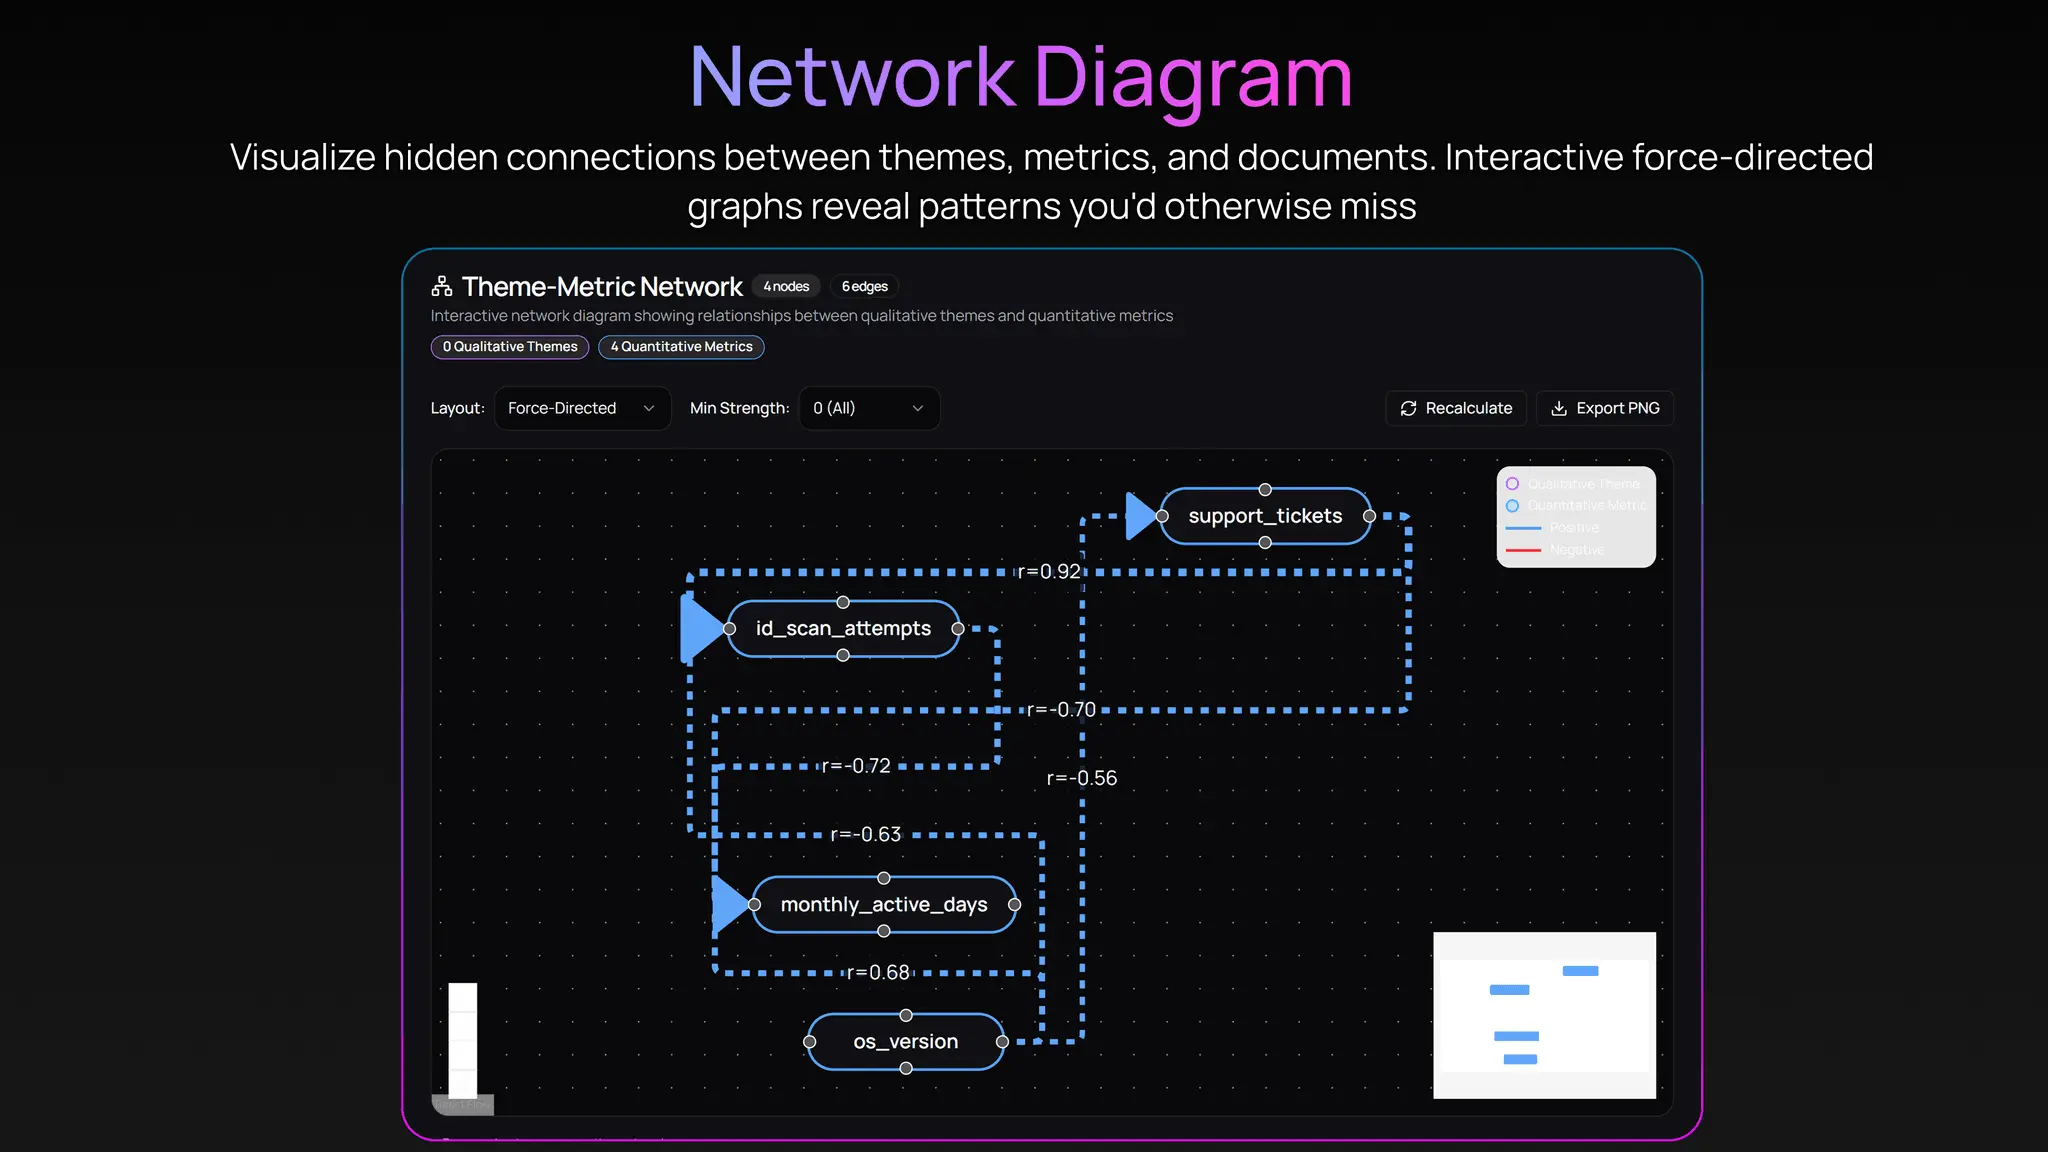
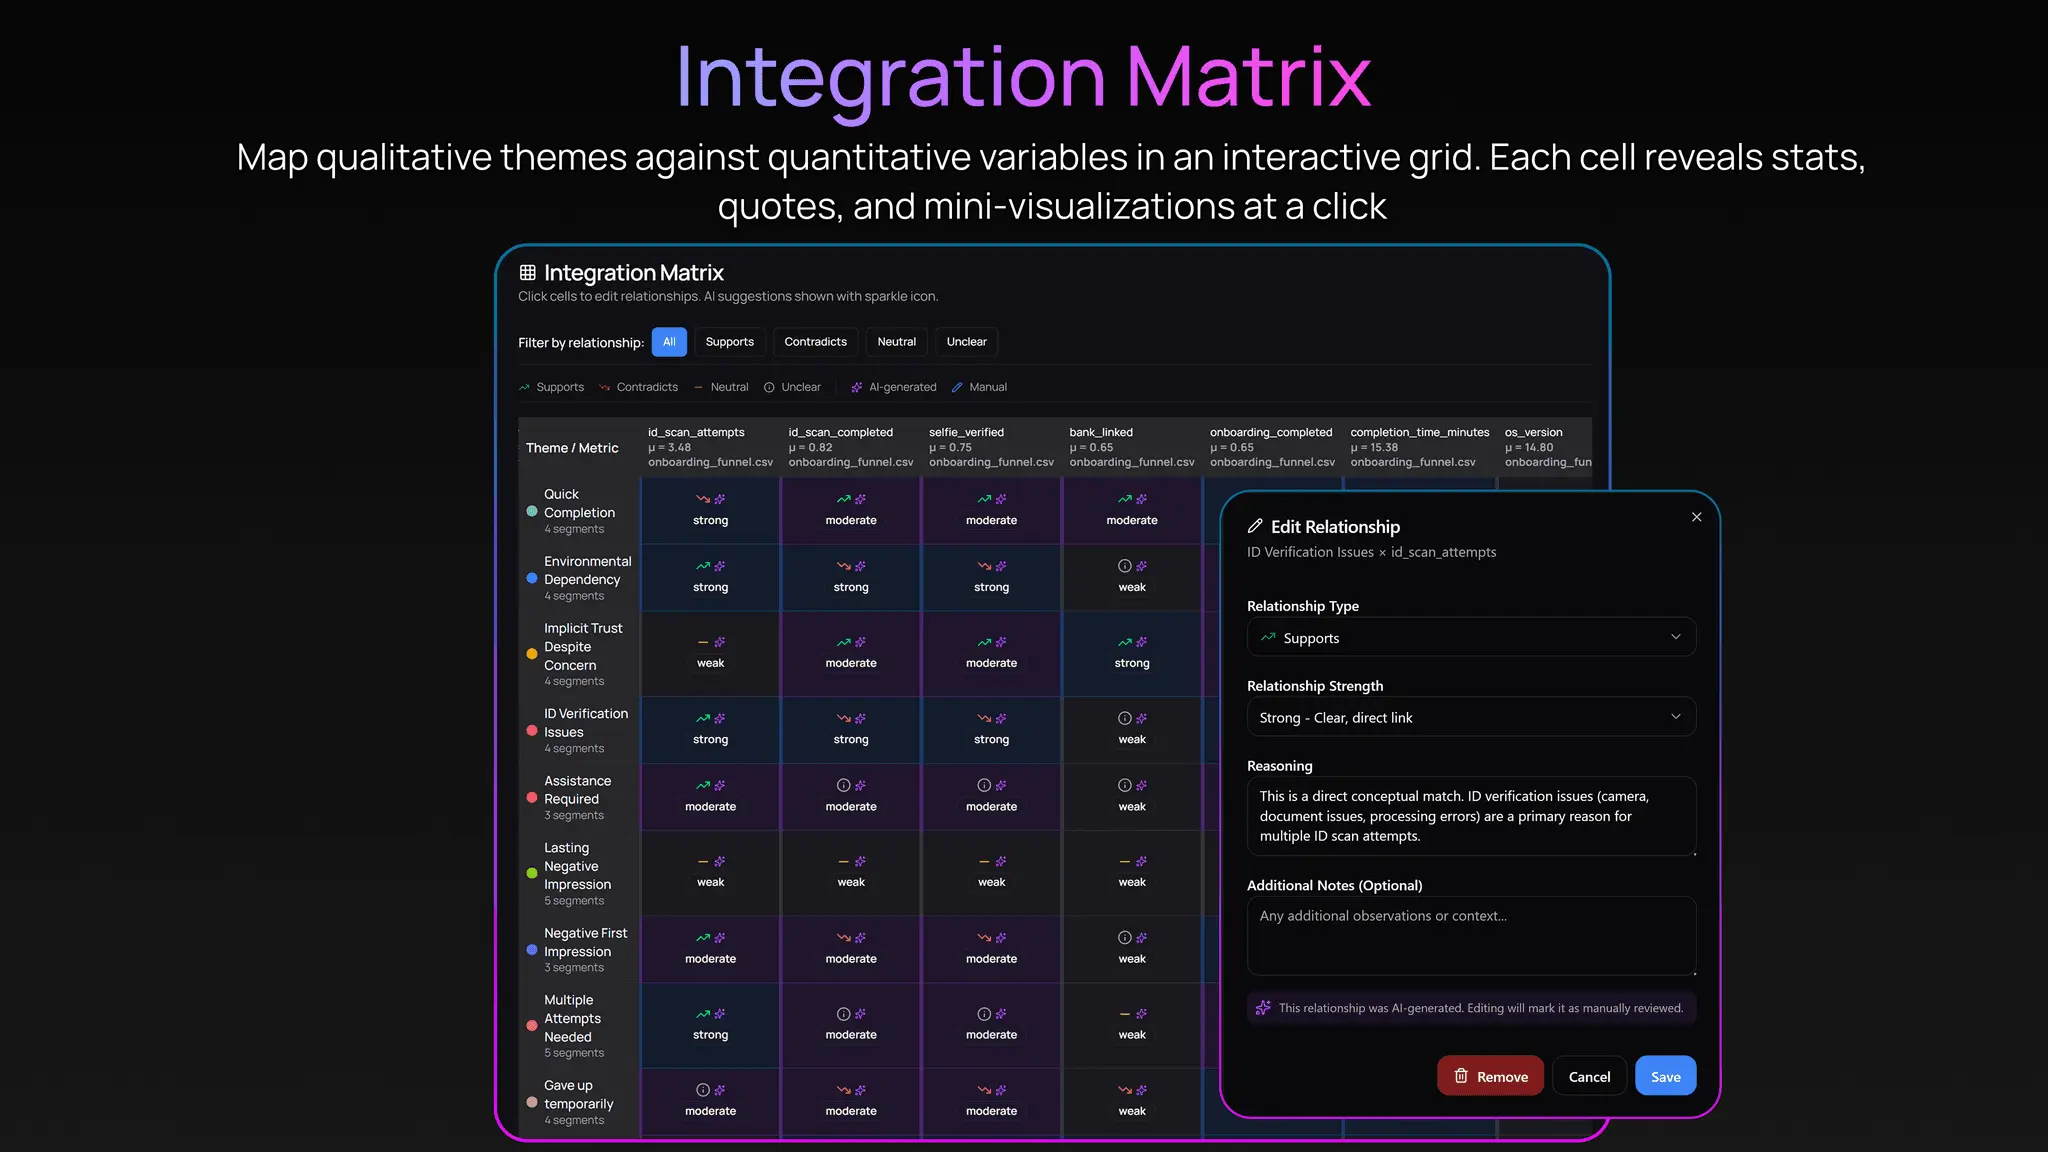
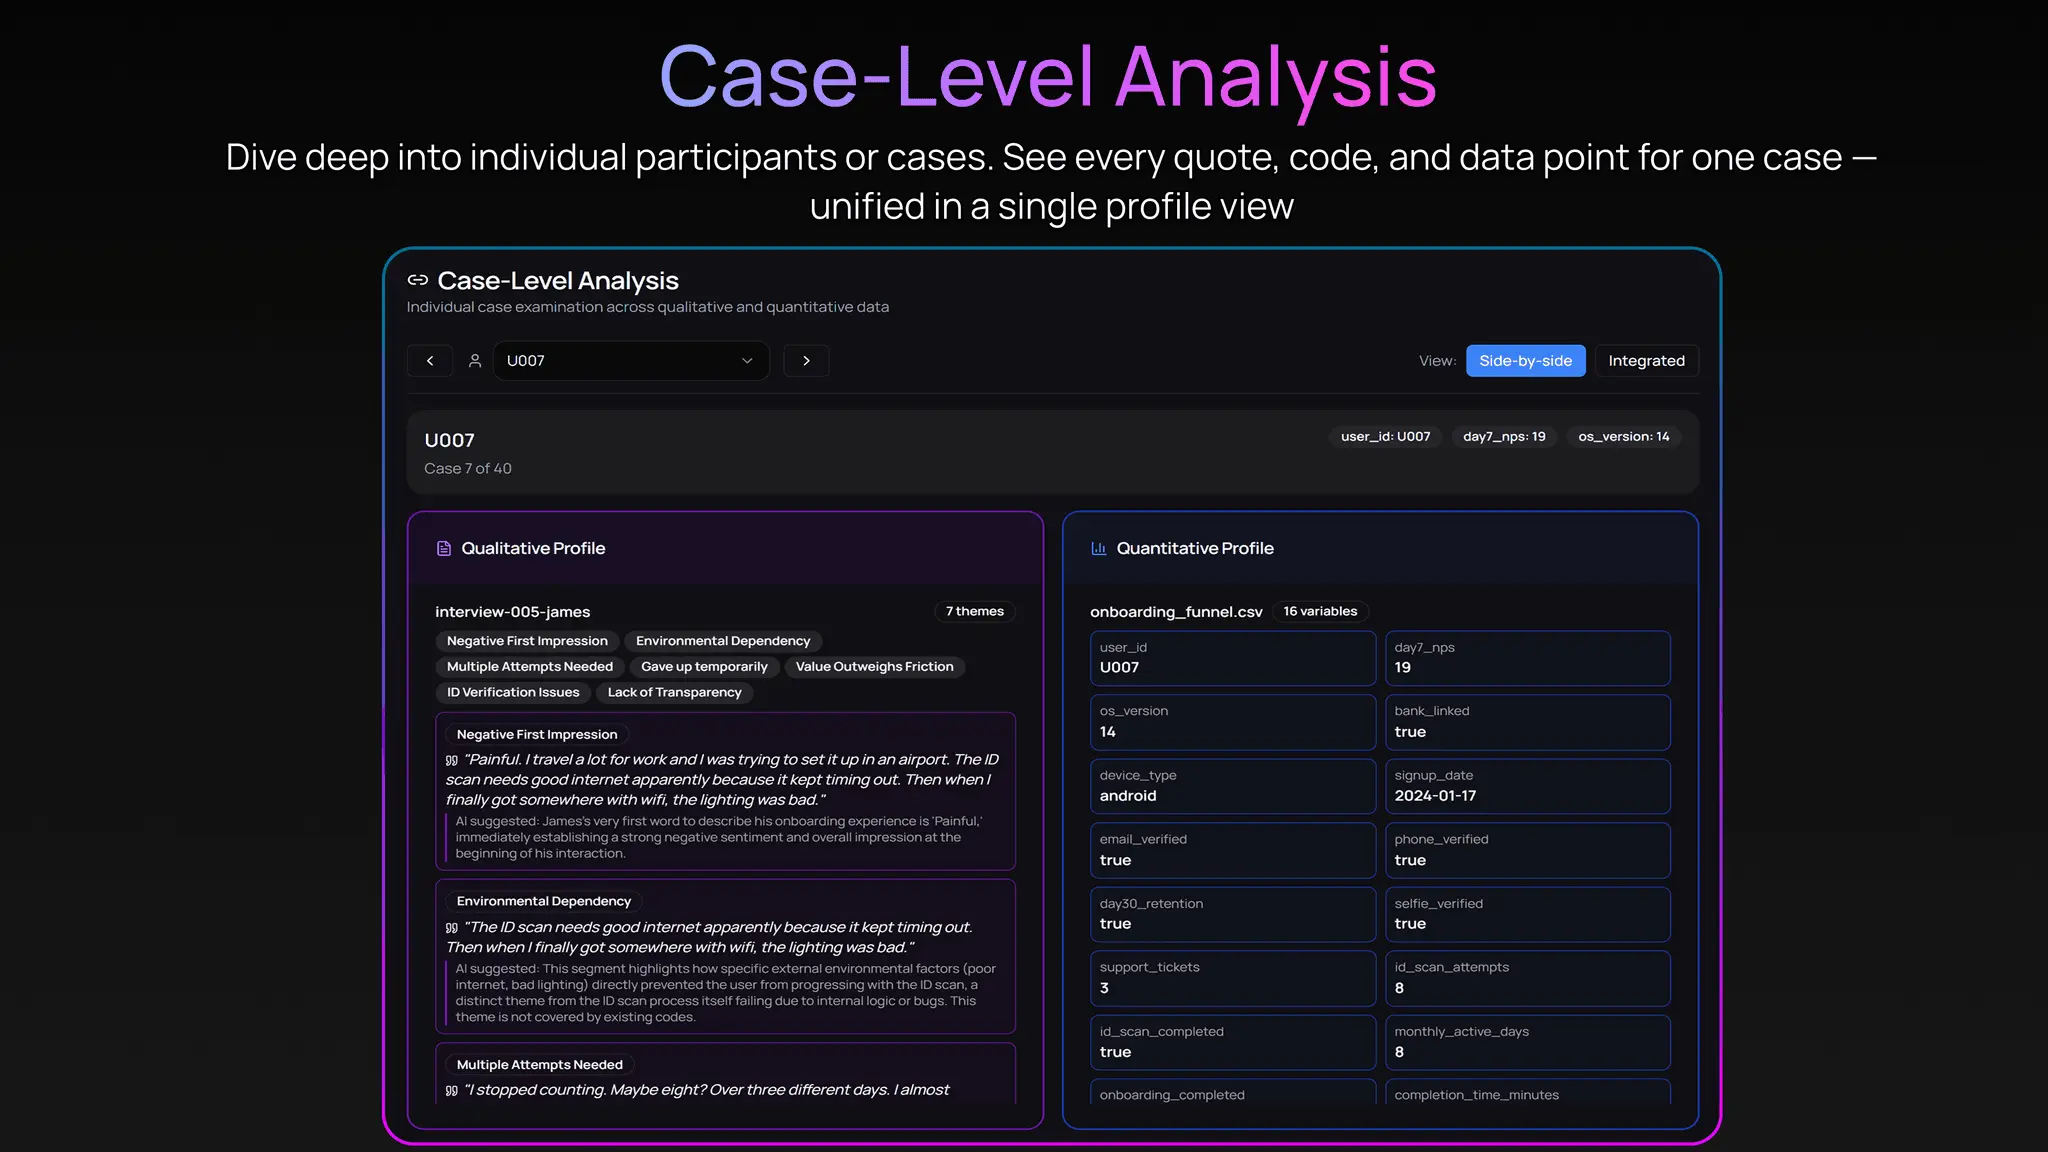
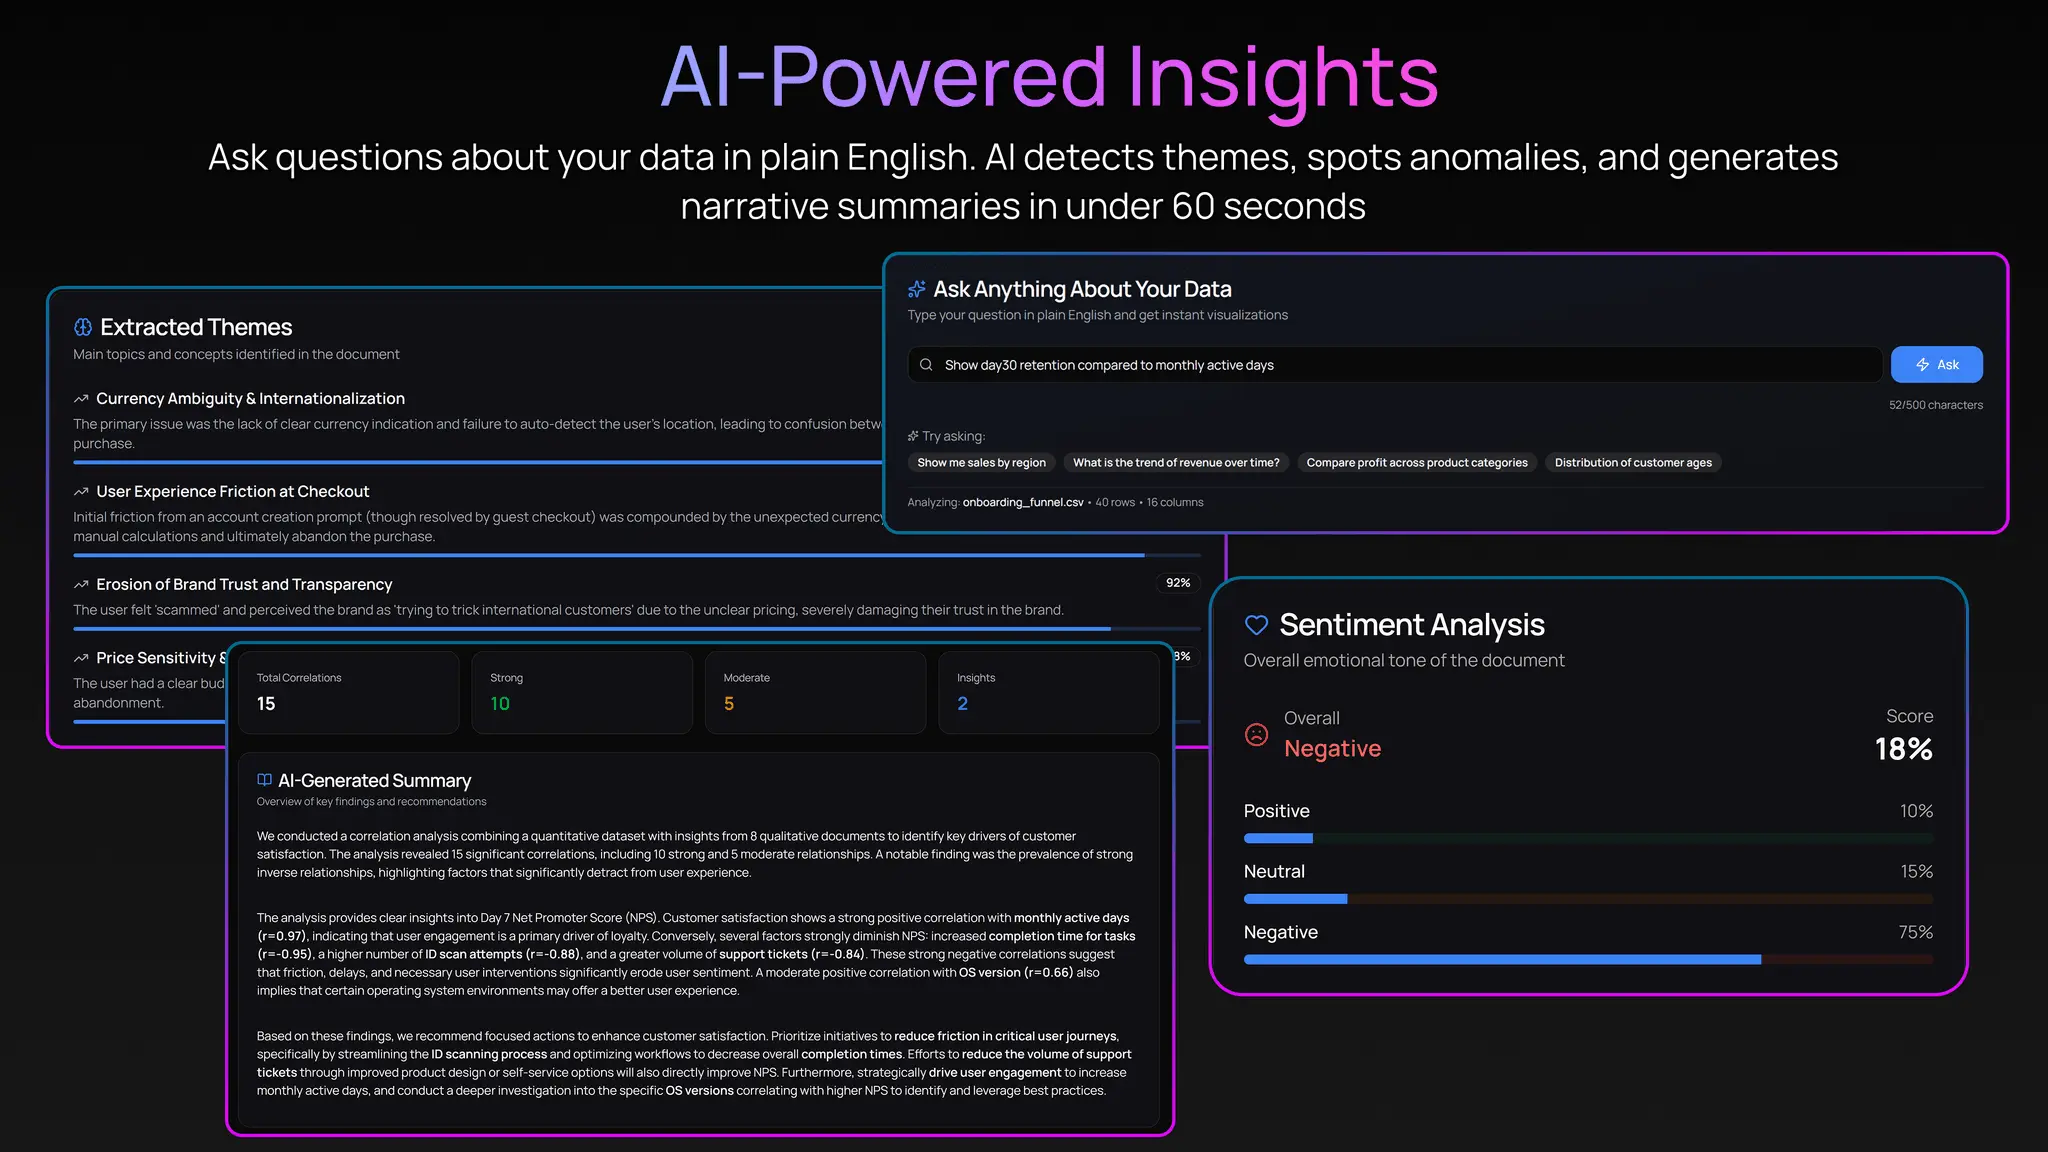
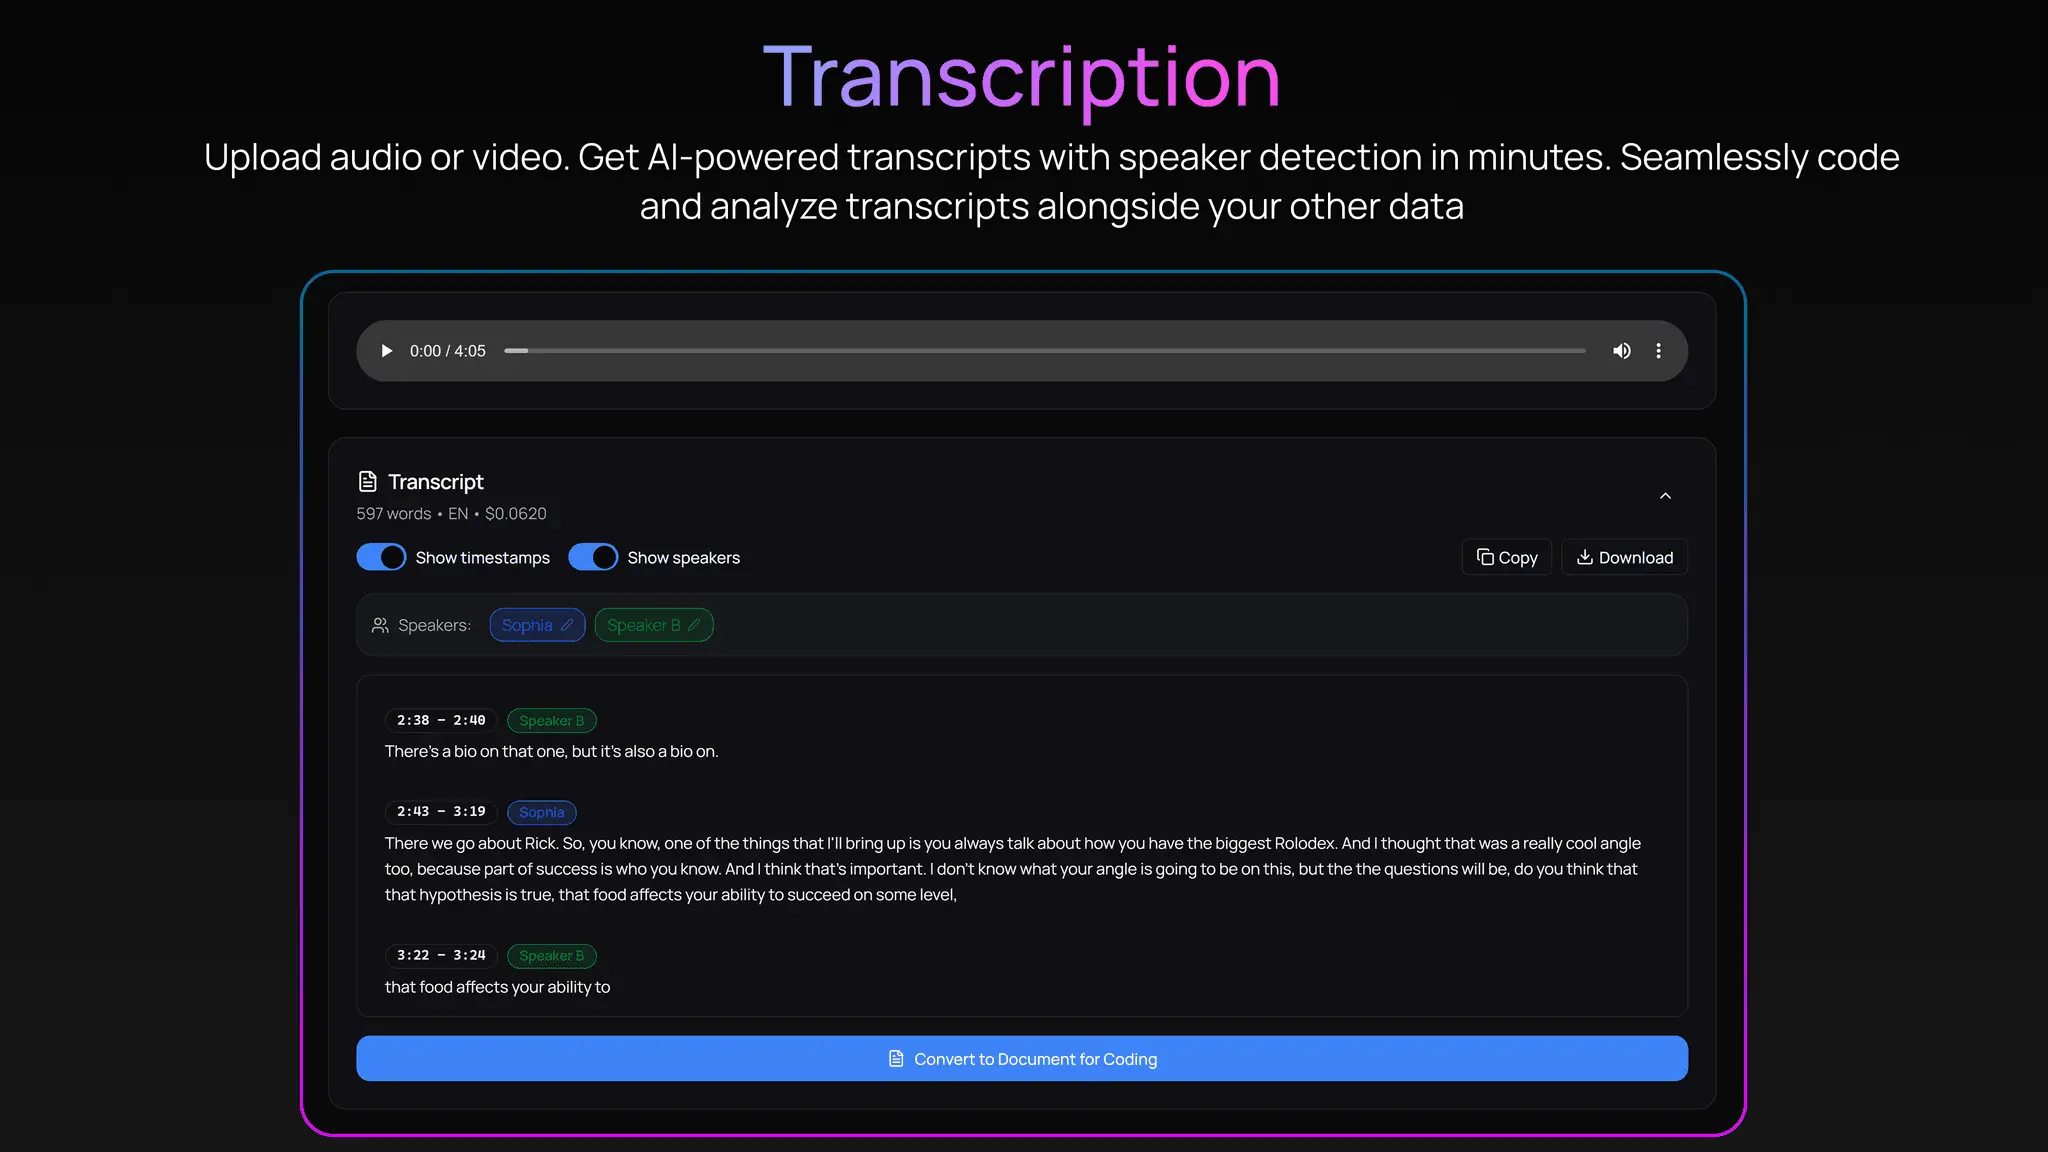
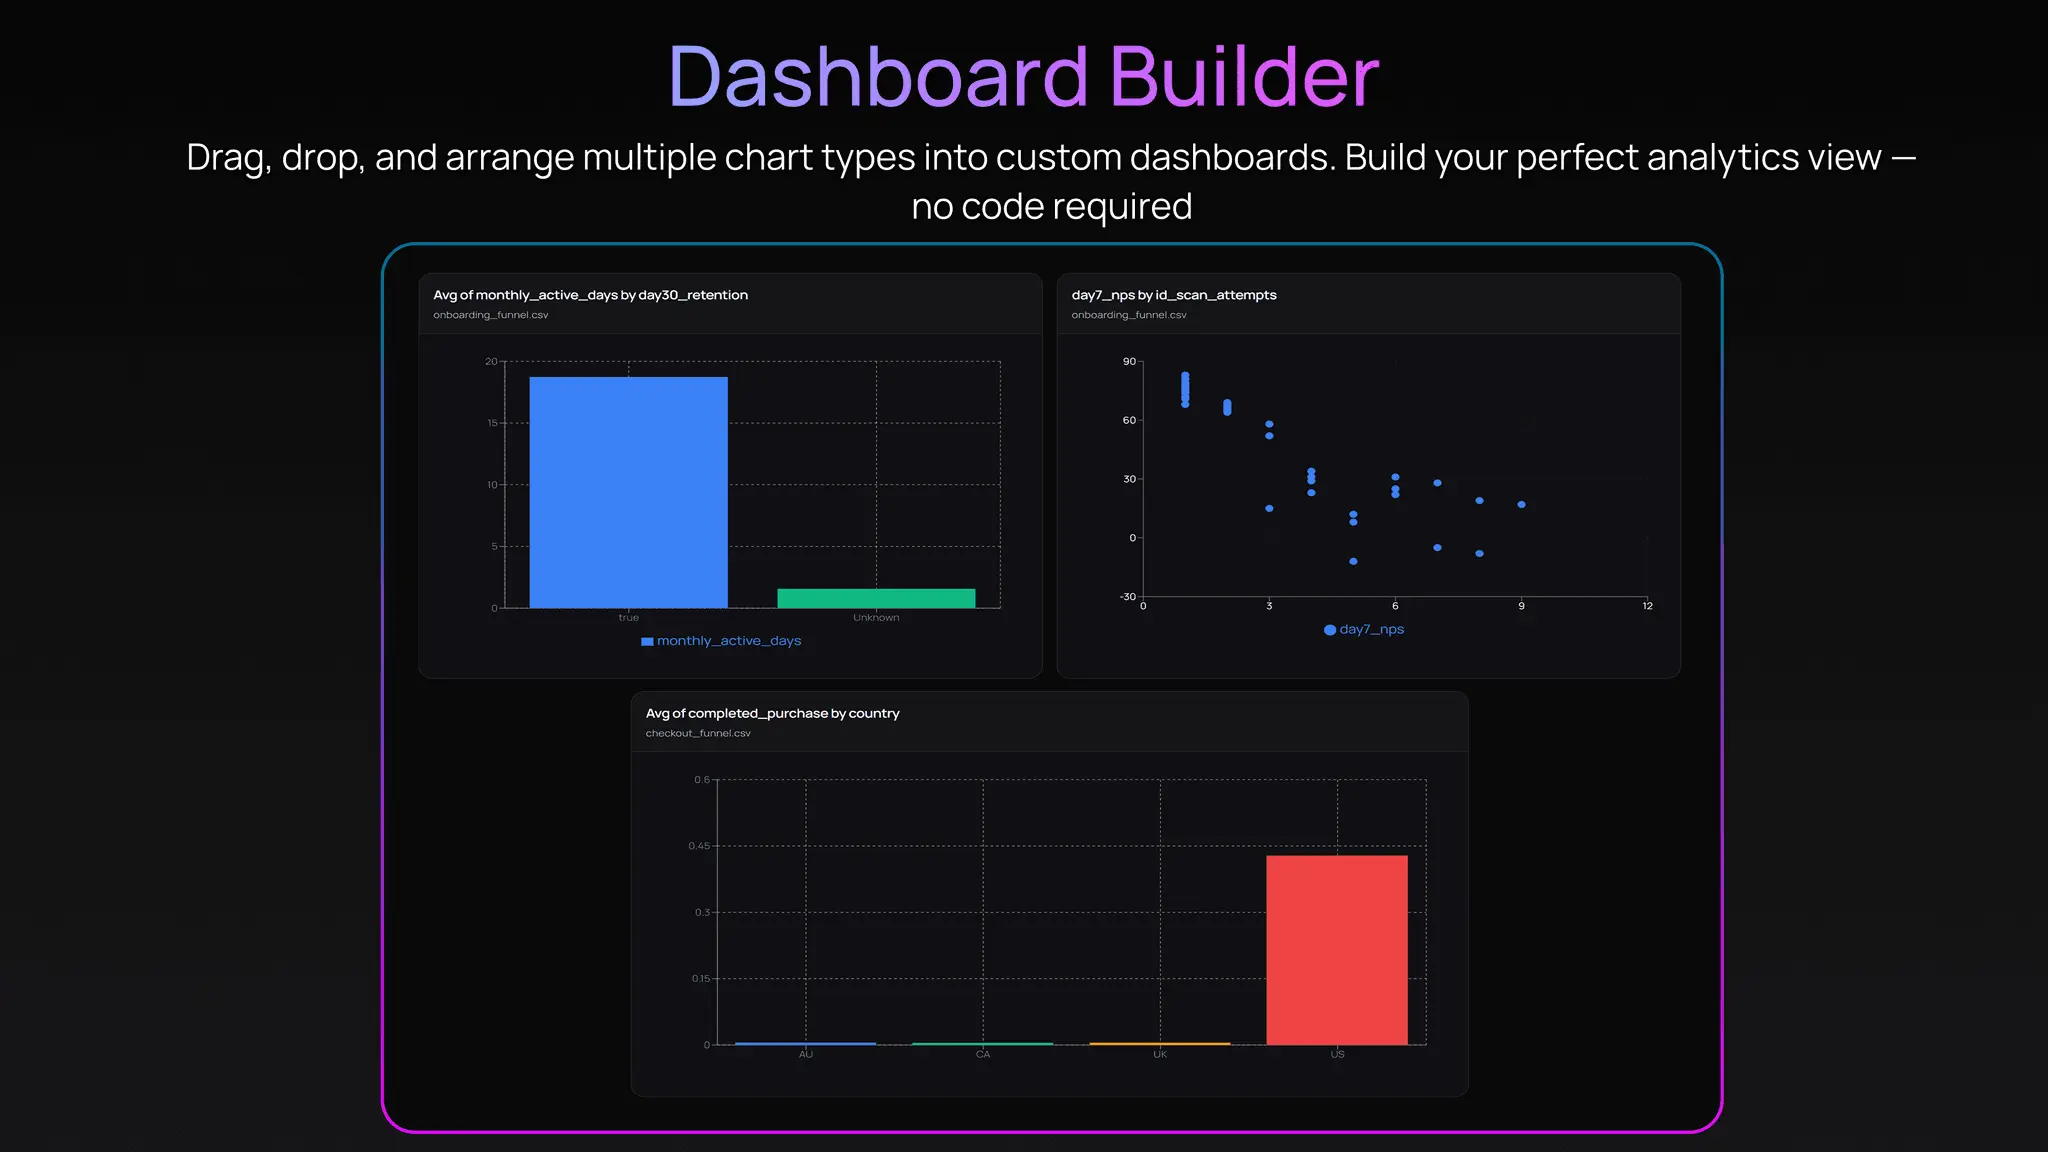
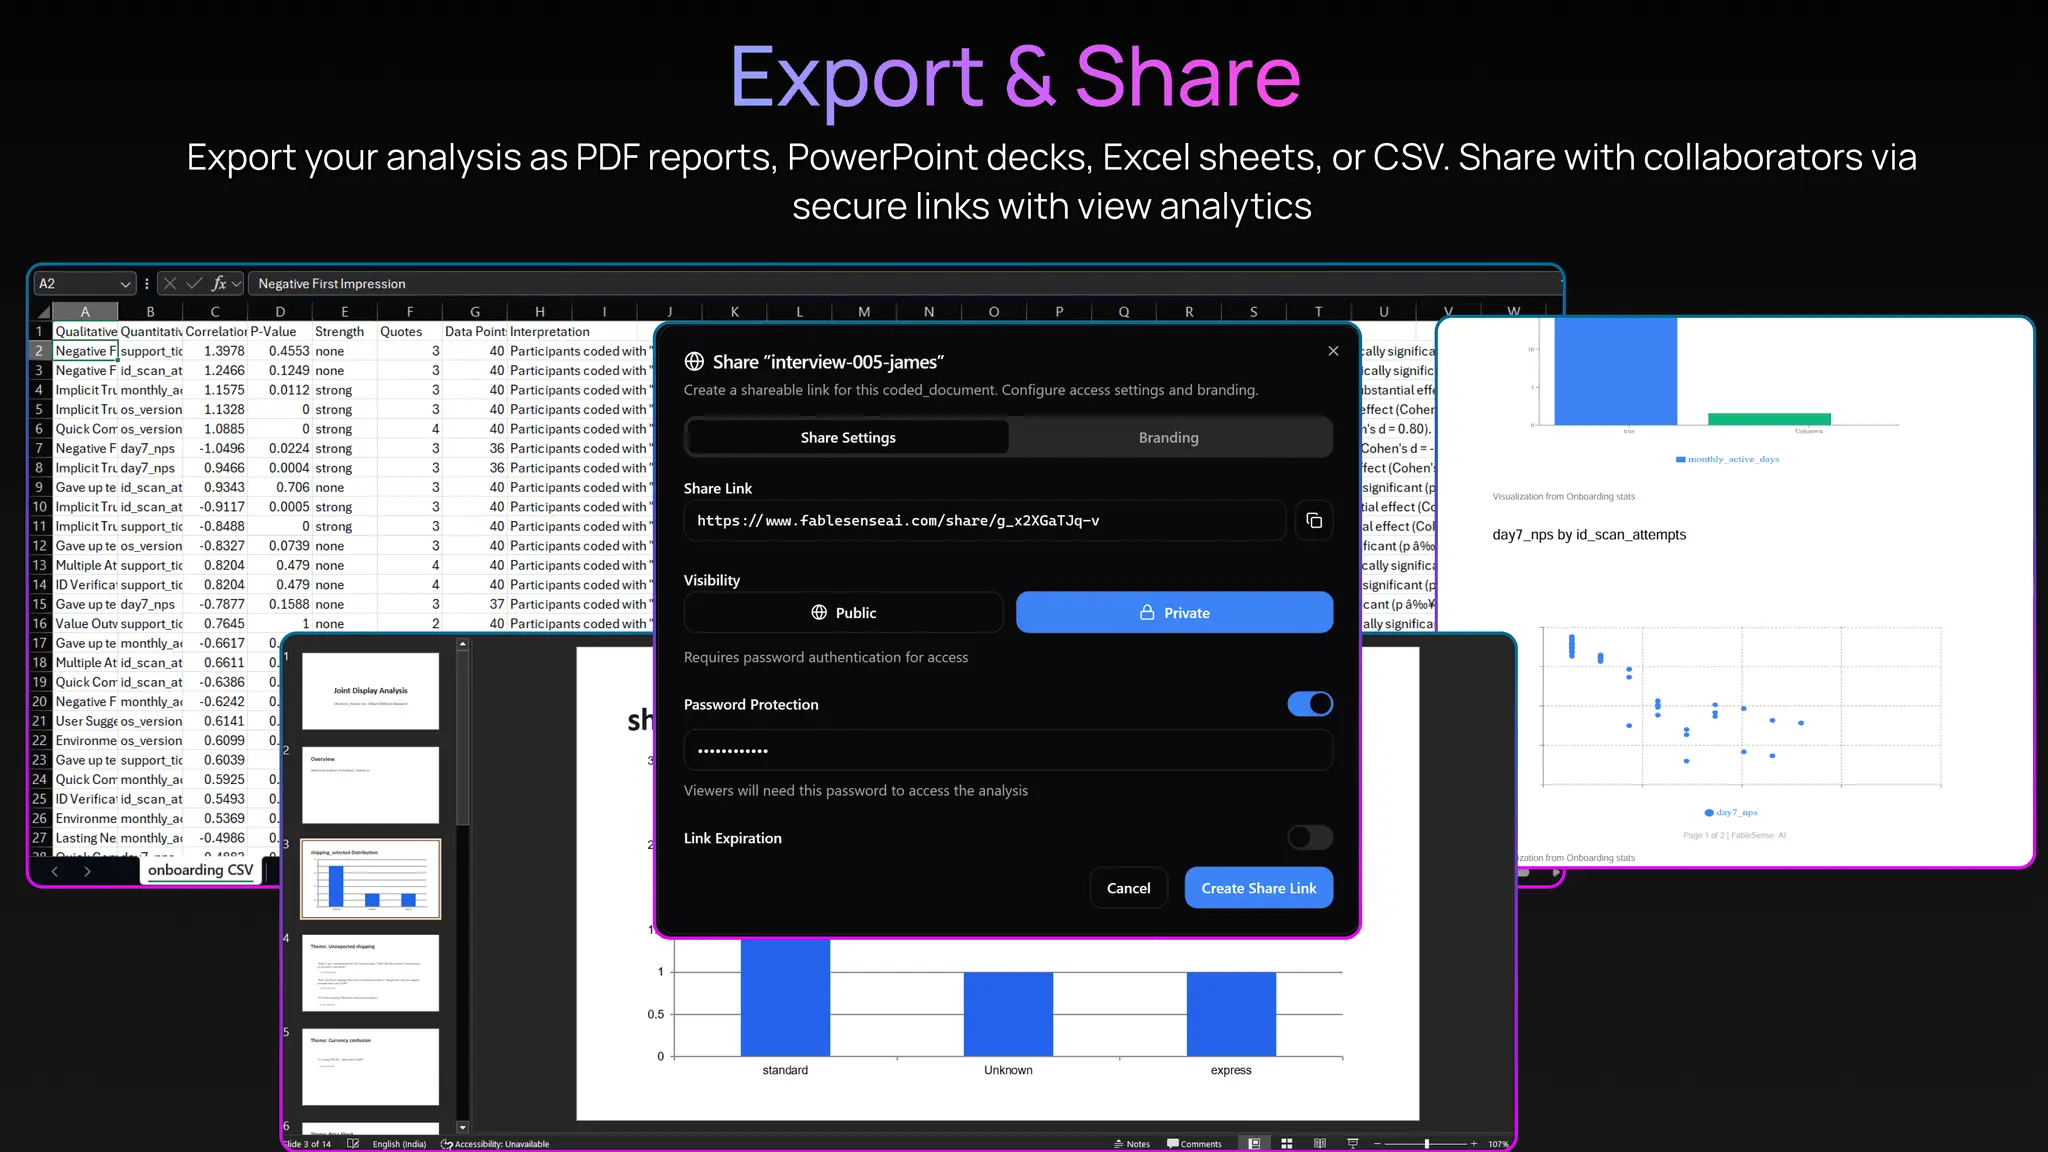
Most analytics tools handle numbers well, but researchers often work with both qualitative data (interviews, transcripts, open-ended responses) and quantitative data (surveys, metrics, spreadsheets), and there's no single tool that brings them together. That's what FableSense AI does. Here's what it offers: - Qualitative Coding - highlight and tag interview transcripts with color-coded themes, build hierarchical code frameworks, and track code co-occurrences - Quantitative Visualization - upload CSV/Excel/SPSS files and build scatter plots, histograms, box plots, bar charts, and more - Joint Displays - view qualitative themes and quantitative stats side-by-side in a synchronized split view, which is the gold standard for mixed-methods research - Correlation Heatmaps - spot which qualitative themes drive which metrics, with AI-generated plain-English explanations of what the correlations mean - Network Diagrams - interactive force-directed graphs showing connections between themes, metrics, and documents - AI-Powered Insights - auto theme detection, sentiment analysis, anomaly detection, and you can ask questions about your data in plain English - Audio/Video Transcription - upload recordings and get AI-powered transcripts, then code and analyze them directly - Dashboard Builder - drag-and-drop custom dashboards with multiple chart types - Export & Sharing - export to PDF, PowerPoint, Excel, CSV, or share via secure links with built-in view analytics Who it's for: - UX researchers running user interviews alongside survey data - Academics doing mixed-methods dissertations or studies - Market researchers combining focus groups with quantitative surveys - Healthcare researchers analyzing patient interviews with clinical metrics - Anyone tired of switching between NVivo, Excel, and Tableau to get the full picture There's a free tier (no credit card needed), and paid plans start at $18/month - with a 25% academic discount.
Product Insights
FableSense AI is a web-based mixed-methods research platform that merges qualitative coding of transcripts with quantitative data visualization. It provides a unified workspace for analyzing interviews and metrics through joint displays, network diagrams, and AI-driven insights.
- Synchronized split-view displays for side-by-side qualitative and quantitative data analysis.
- Integrated AI features for automated transcription, sentiment analysis, and theme detection.
- Comprehensive visualization tools including interactive network diagrams and correlation heatmaps.
- Accessible pricing model with a free tier and specific discounts for academic users.
Ideal for: UX researchers, students, and data scientists who need to synthesize qualitative interview transcripts with quantitative survey metrics in a single environment.
Screenshots
Reviews (0)
No reviews yet. Be the first to rate this product!
Comments (2)
The joint displays feature for mixed-methods research is a standout. Being able to view qualitative themes alongside quantitative stats in a synchronized split view is exactly what researchers need. Great tool!
@mitchell Thank you so much! I’m honestly so happy to hear that the joint displays stood out to you. I really wanted to solve that 'tab fatigue' researchers face. If you have any feedback on how to make it even better, I'd love to hear it!
FableSense AI is live! After months of building, I'm excited to finally share it. One platform for all your research analysis: CSV, PDF, audio, SPSS files, AI insights, and polished exports.