
infoAIgraphic
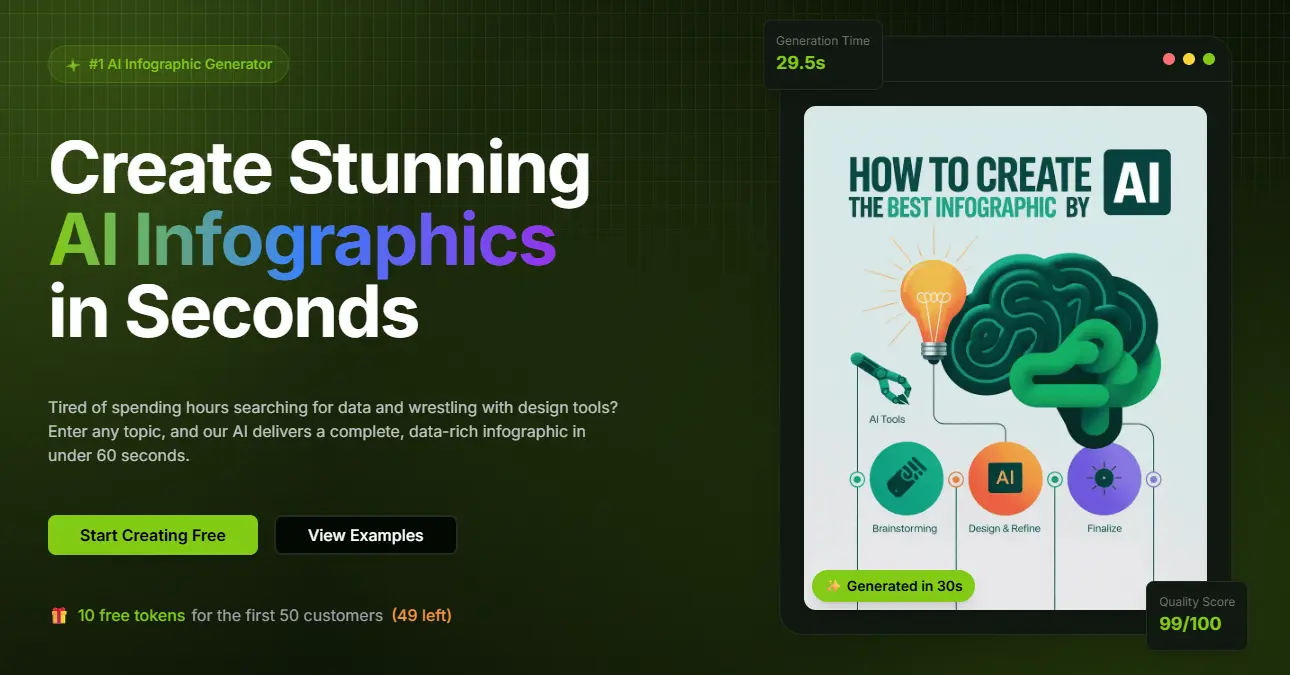
Create infographics with AI in seconds
Details
- Follow on
- @mateo_startup
- Categories
- AIDesign ToolsImage Generation
- Target Audience
- Content CreatorsMarketersEducators
- Platforms
- Web
About infoAIgraphic
I’m Matt, a solo developer and the only person to blame for this thing existing. Not long ago I walked away from a safe full-time job to put everything into my first own product: infoAIgraphic. For years I did what you probably do too: hours of research, 20 tabs open, cobbling together data… and then wrestling with Canva or some other “easy” design tool that somehow eats your entire afternoon. I just wanted something simple: I type in a topic → I get a clear, good-looking infographic I’m not embarrassed to share. So I built it for myself. Now I’m releasing it into the wild for you. What is infoAIgraphic? infoAIgraphic is basically my one person research and design studio packed into a single app. You give it a topic, short brief, article, lesson or idea, and it: pulls out the key points, organises them into a clear story, turns that into a ready to share infographic for web or print in under a minute. No generic templates you’ve seen a thousand times. Each infographic is generated fresh from your content, so it actually feels like yours, not “that same template everyone uses”. Inside there are two “modes”: a lighter, faster generator for simple, text driven infographics, and a more advanced engine for bigger, more detailed visuals with a richer, more cinematic feel when you really want to impress. Who is it for? I built infoAIgraphic for people who need content, not another complicated design tool: Marketers & content folks - social posts, lead magnets, blog summaries, campaign explainers. Founders & solo makers - one pagers, pricing breakdowns, feature comparisons, roadmaps. Teachers, trainers & educators - lessons, processes and diagrams students can actually follow. Analysts & specialists - reports and data that need to be seen and understood, not buried in slides. If you often think “this would be much clearer as a visual, but I don’t have the time or skills” - this is exactly the gap infoAIgraphic is meant to fill. How it works (from your side, not the tech side) I wanted it to feel more like a conversation than a piece of software. You give it a topic, not an essay “5 mistakes in performance campaigns”, “water cycle for Year 6”, “compare our three subscription plans” – that level of detail is enough. You can also paste in a blog post, newsletter, lesson or brief. The engine does the heavy lifting Behind the scenes it picks out the important bits, groups them, and decides what should be headlines, sections, steps, comparisons, call outs and so on so the whole thing reads like a proper story, not a wall of text. You get a finished infographic You choose the layout (stats, process, comparison, etc.), the aspect ratio (square, portrait, landscape) and the general visual vibe. Then you download a clean, high resolution file ready for whatever you need – social, slides, PDF, print. If you don’t love the result, you can simply regenerate a new variation from the same prompt no pixel pushing required. How I think about pricing I personally hate subscriptions I forget about and then feel guilty for not using. That’s why infoAIgraphic runs on packs of credits: you pay for what you actually generate. No “use it or lose it” by the end of the month. There are several tiers (from starter to more heavy-duty use), which differ by things like: how many infographics you can generate, how advanced the engine is, output options and priority. In practice: you can start small, see if it genuinely fits your workflow, and only then decide if you want to scale it up. Why you might actually enjoy using this You’re not learning a tool – the tool is learning you. You focus on your message; infoAIgraphic handles the structure and visuals. You swap hours for minutes. Going from “idea” to “finished infographic” usually takes less than a minute, instead of swallowing an afternoon. You don’t need to be a designer. This is for people who want a solid outcome, not a new profession. You get a say in what comes next. I’m a solo founder. There’s no product team between your feedback and the roadmap - I read every message and adjust based on what real users are actually trying to do. I’d love your feedback so I can fix anything unclear and you can help decide what I build next.
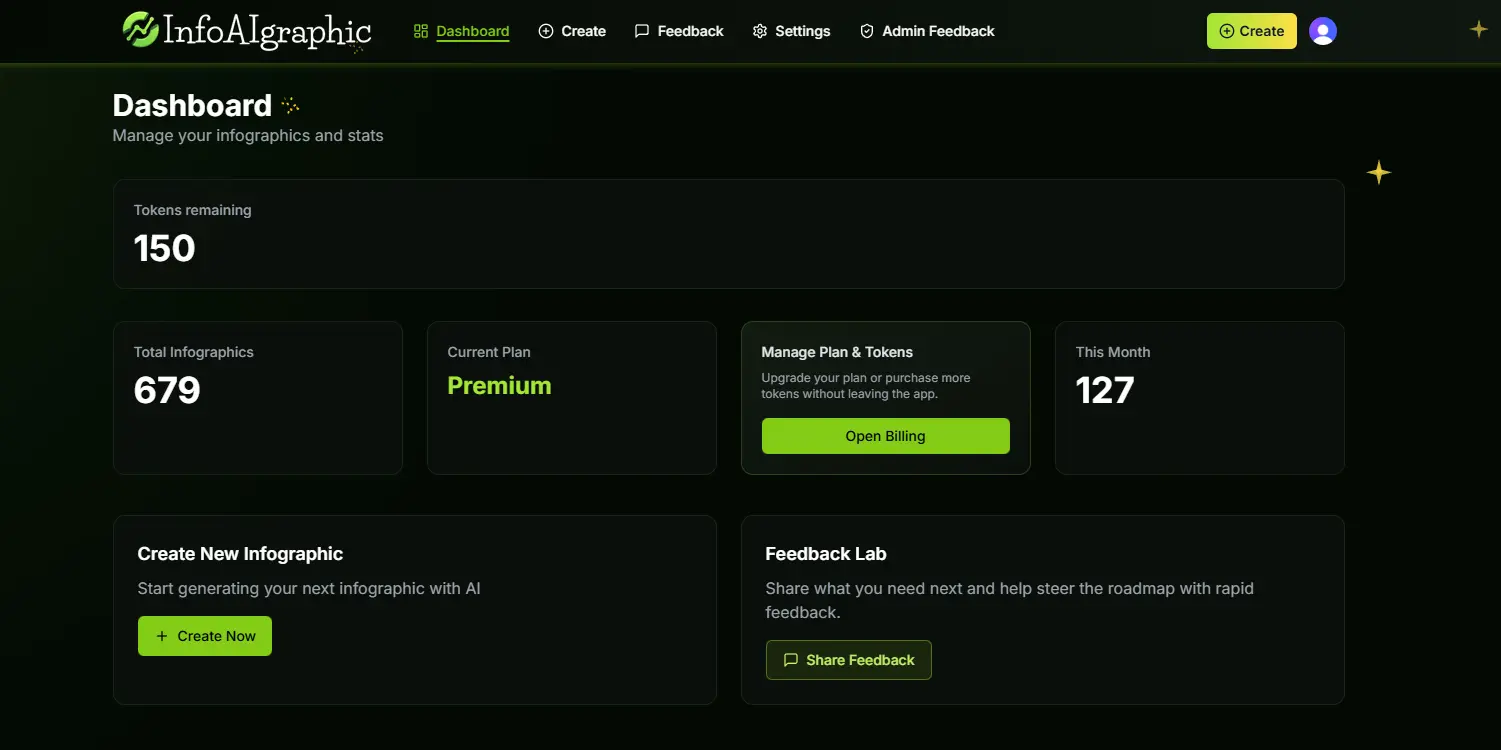
Product Insights
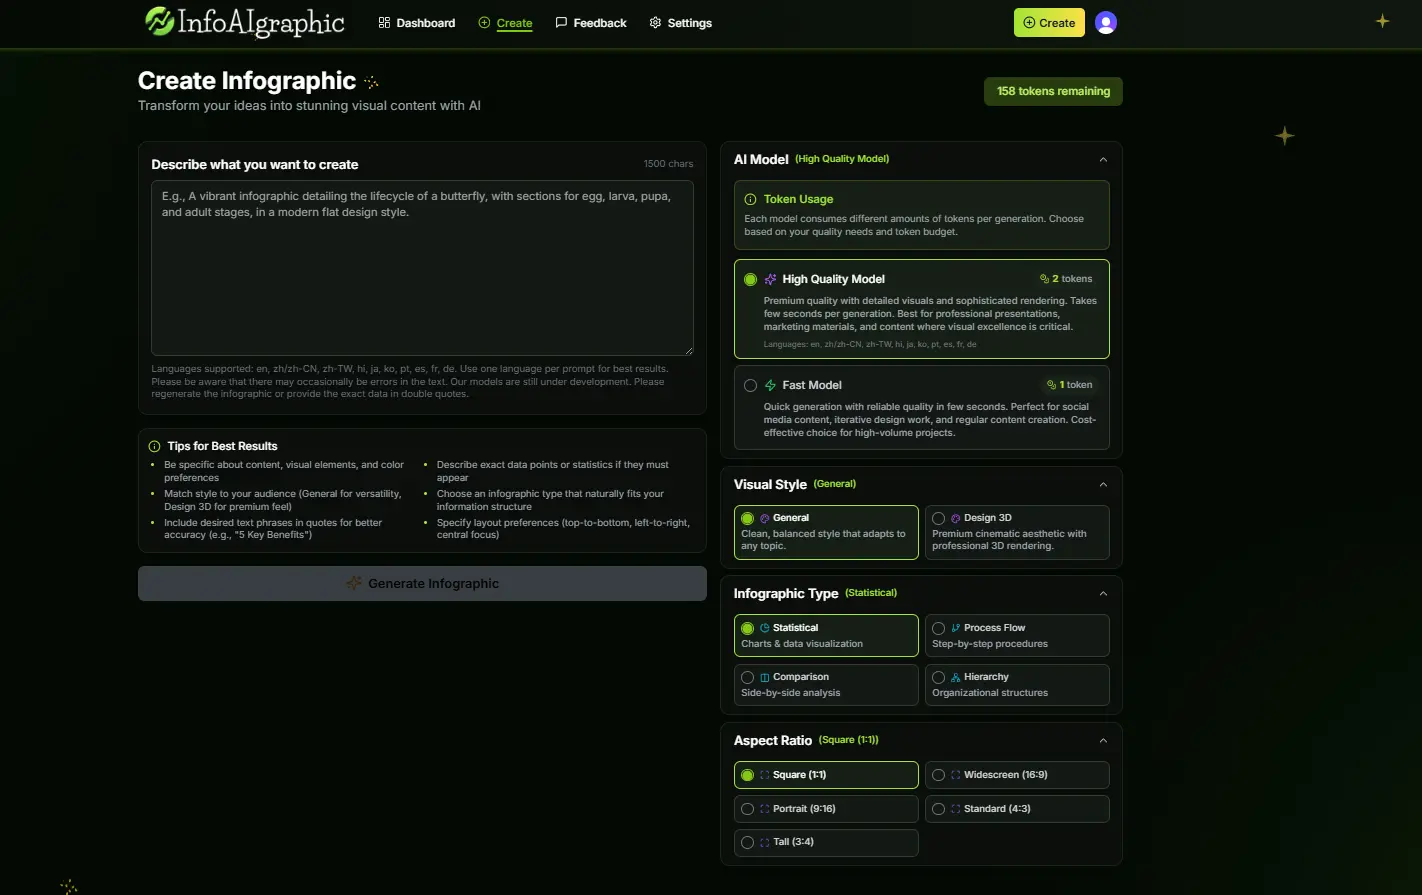
infoAIgraphic provides a automated research and design workflow that transforms text topics or long-form content into structured infographics. The web-based platform utilizes dual AI engines to generate distinct visual styles suited for both simple summaries and detailed reports.
- Generates structured narratives from raw text, articles, or brief topics in under a minute.
- Offers two generation modes optimized for either text-driven visuals or detailed cinematic designs.
- Supports multiple aspect ratios including square, portrait, and landscape for social and print.
- Provides layout options for specific data types such as processes, comparisons, and statistics.
Ideal for: Content creators, marketers, and educators who need to transform complex information or lessons into clear, shareable visuals without using manual design tools.
Screenshots
Reviews (0)
No reviews yet. Be the first to rate this product!
Comments (2)
AI-powered infographic creation in seconds? This solves a huge pain point for content creators!
Yes its true :)
Cool product! I will use it for my social media
Thanks Laura :)