Hey PeerPush! 👋
We spent way too much time analyzing stock heatmaps that weren't designed to reveal insights. Most heatmaps force you to view every metric—market cap, volume, price changes—through identical static layouts, even though these metrics tell completely different stories. A $3 trillion company dominates the visual space even when analyzing volume or price change, while smaller high-volume movers get buried. Switch from market cap to volume? The layout stays exactly the same.
We asked ourselves: why should the visualization stay static when the data is dynamic? And why is it so hard for everyday investors to extract the information we need to make educated decisions?
We then rebuilt stock heatmaps from the ground up using two core principles:
The visualization should adapt to serve the data, not the other way around.
Complex information should be made clear, understandable and actionable.
This led to:
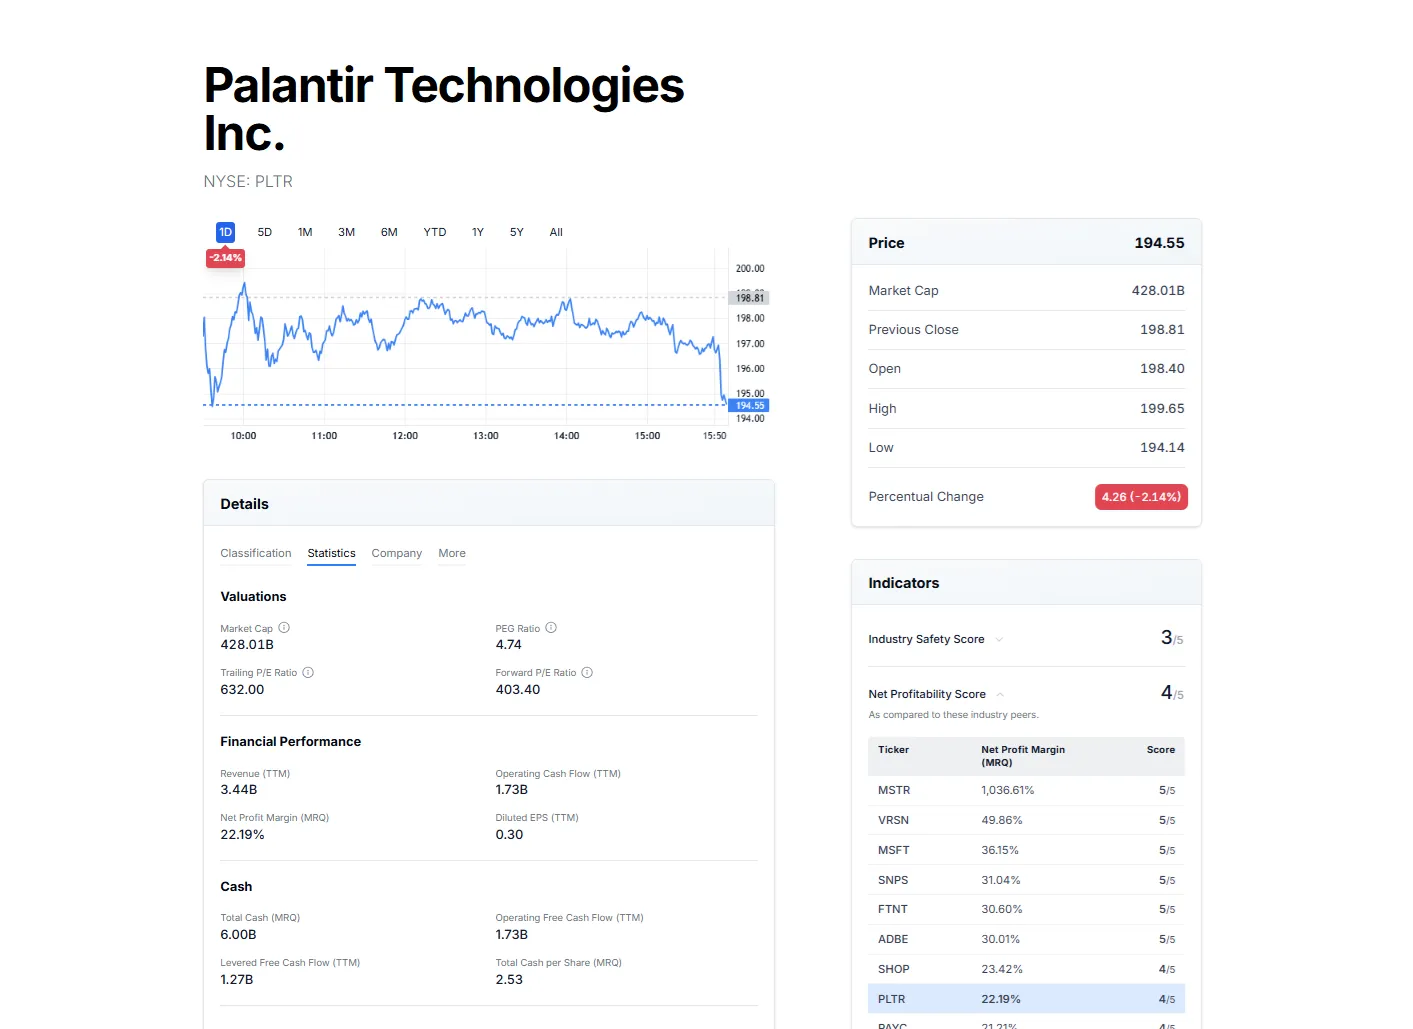
- Deobfuscation — No finance degree required, clear explanations for every term. Contextual articles, risk indicators, and peer comparisons across major indices (S&P 500, Nasdaq 100, Dow Jones) and super investor portfolios (Warren Buffett, Cathie Wood, Carl Icahn). Complex information, made simple.
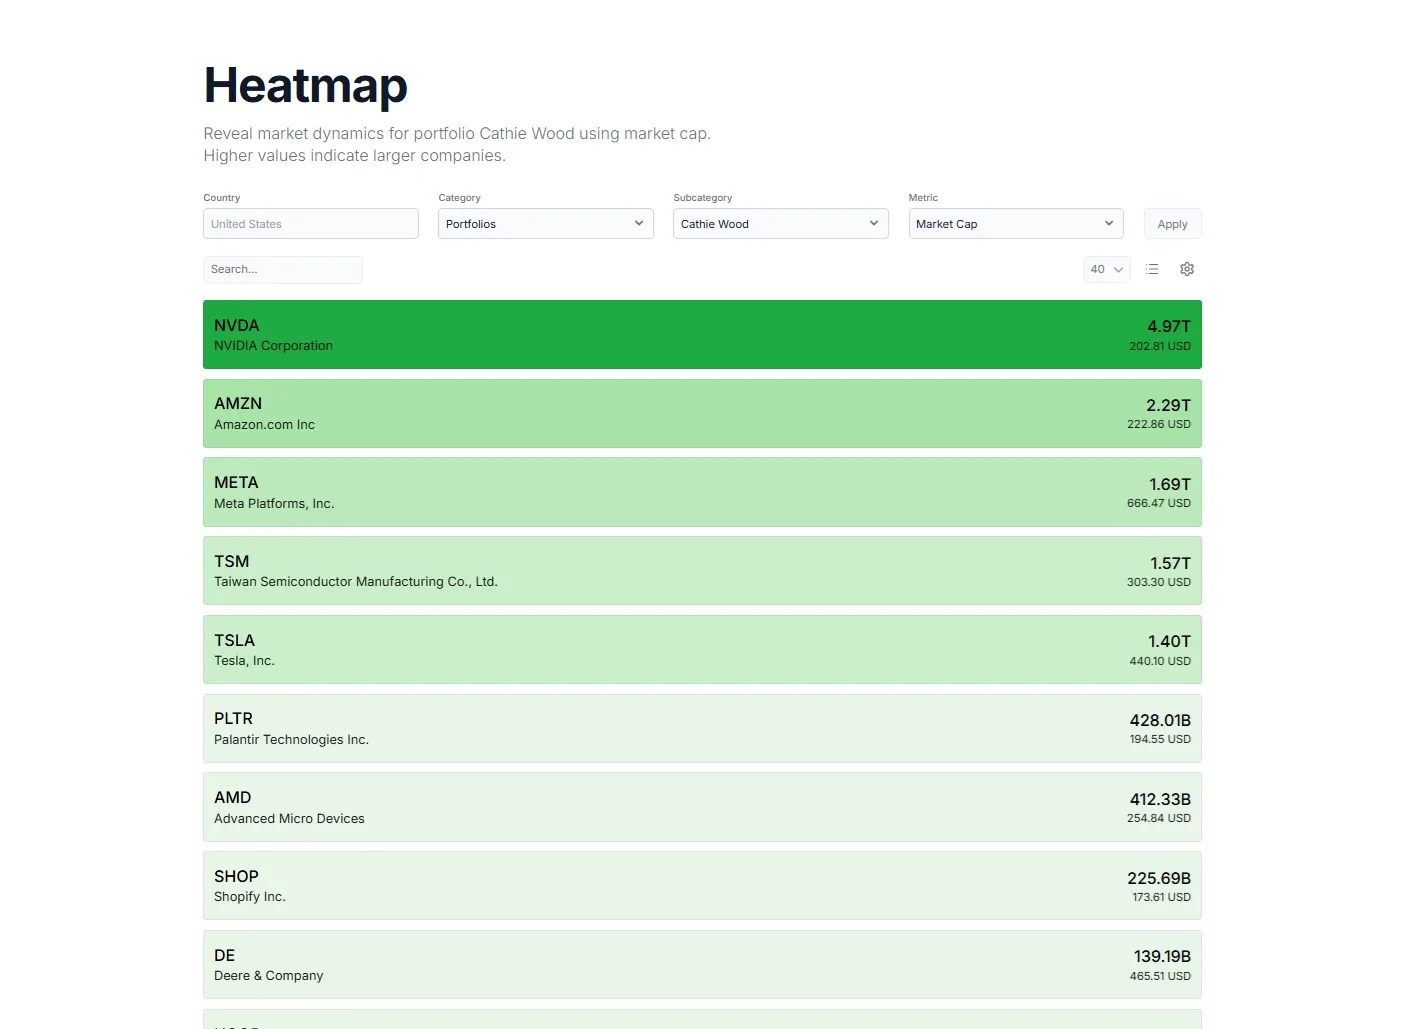
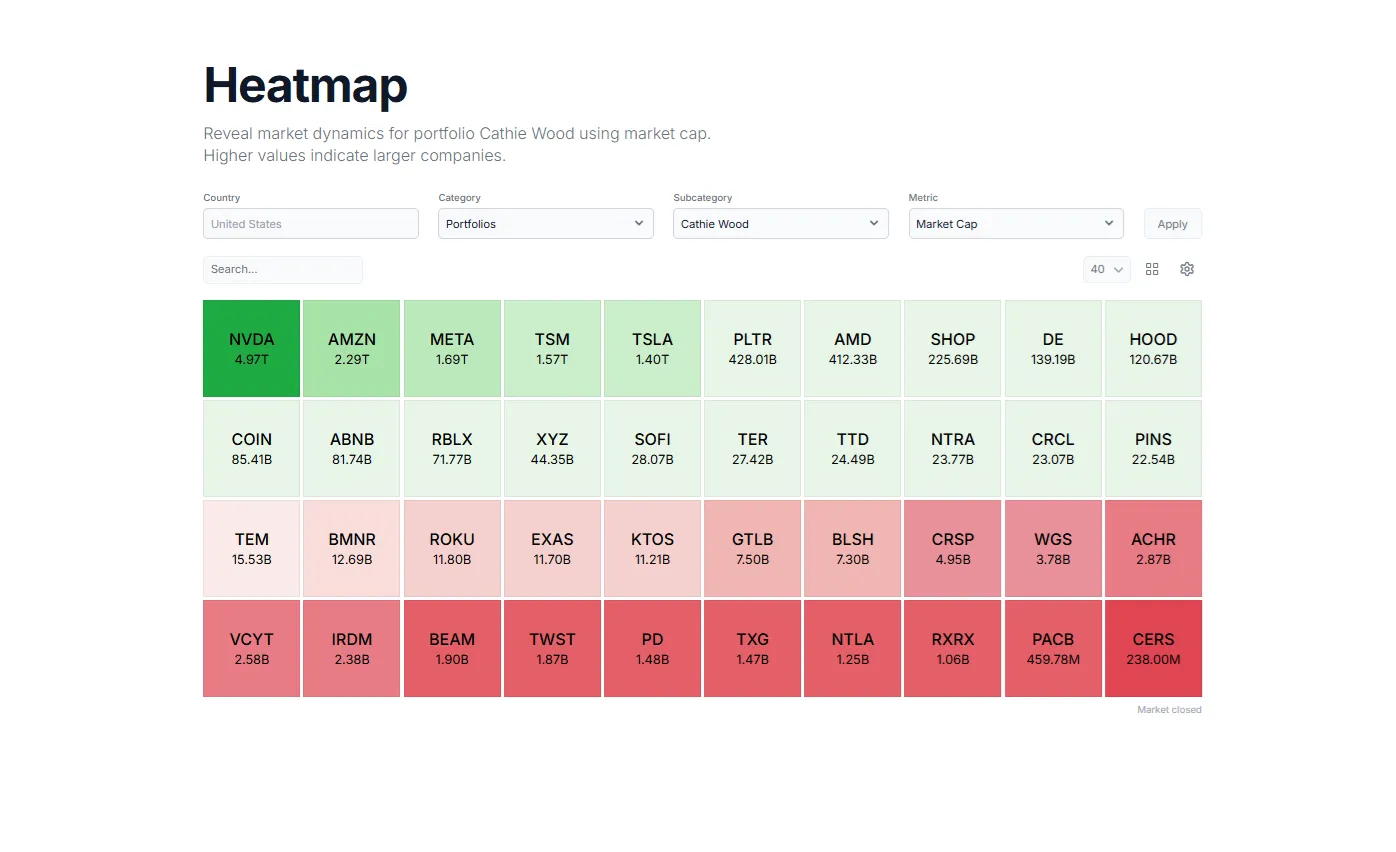
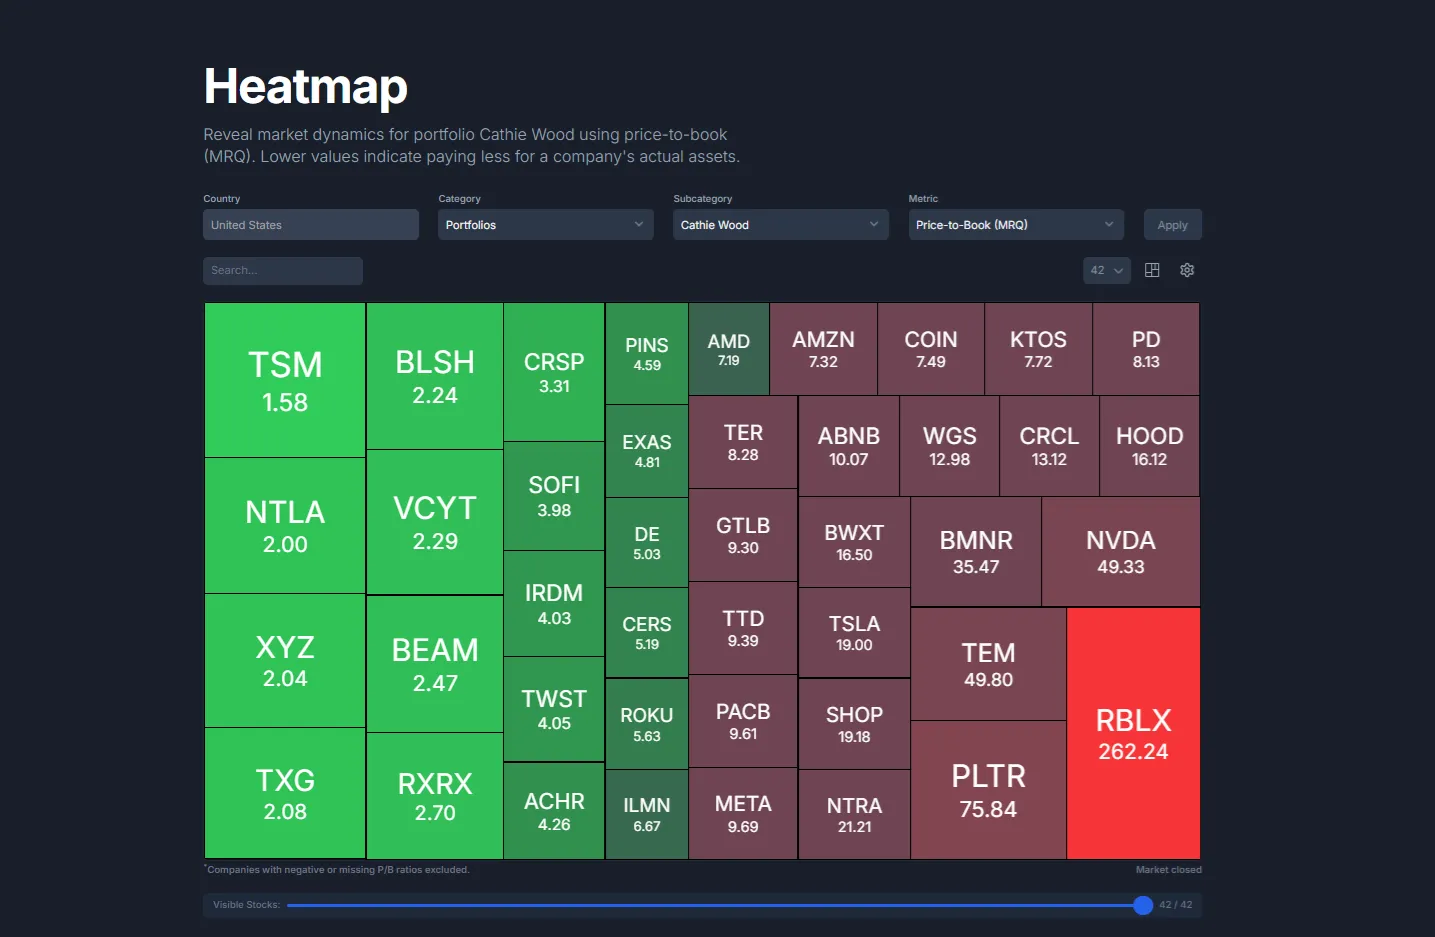
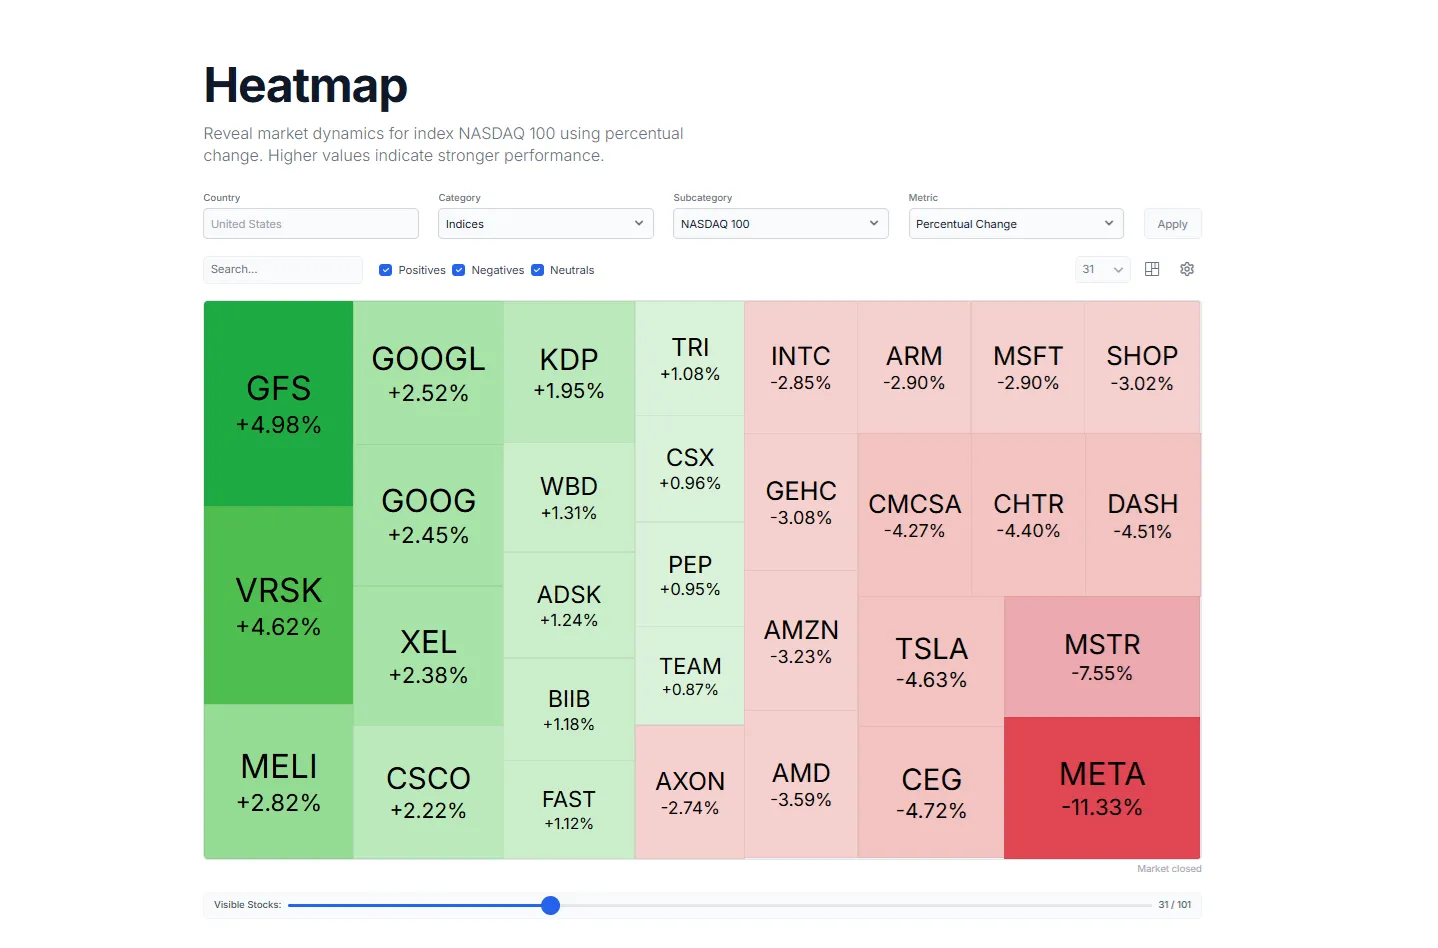
- Adaptive layouts — Tile sizes automatically adjust based on your selected metric. Viewing by volume? High-volume stocks get prominent placement. Switch to PEG ratio? Value opportunities dominate. The layout reorganizes itself to make outliers and patterns immediately visible.
- Powerful interactivity — Real-time updates with smooth transitions. Analyze performance across multiple time ranges (1D, 5D, 1M, YTD, etc.). Use the free-range selector to show any number of stocks you want—declutter the S&P 500 to 50 picks, create a focused 13-stock view, or any custom range. Filter for positives-only or negatives-only. The heatmap responds instantly to how you want to analyze the market.
- Multiple viewing modes — Seamlessly switch between treeview, blocks and list views, with modern or classic themes. Color gradients and size relationships work together to automatically surface unusual volume spikes, divergences, and opportunities.
- Mobile-first design — Built with modern technologies for speed and responsiveness. Designed for touch from day one, with gesture controls and smooth animations that make mobile analysis actually enjoyable. Not a desktop interface squeezed onto your phone.
We wanted to rethink how visual tools should adapt to complex, fast-moving markets, and we think we solved it: stock heatmaps that represent market dynamics and finally work the way your brain does.

Comments (1)
I like the part that you can choose your own metric! Well done
Thanks for the compliment, much appreciated ❤️