StartupSubmitStartupSubmit
VeilProxyVeilProxy
LaunchDirectoriesLaunchDirectories
Spanora, AI Agent Observability PlatformSpanora, AI Agent Observability Platform
Calm SeaCalm Sea
Advertise
StartupSubmitStartupSubmit
VeilProxyVeilProxy
LaunchDirectoriesLaunchDirectories
Spanora, AI Agent Observability PlatformSpanora, AI Agent Observability Platform
Calm SeaCalm Sea
Advertise
PeerPushPeerPush
PeerPushPeerPush
AdvertiseAffiliates (50%)PartnershipsRulesFAQHall of FameNewsletterBlogPricingCategoriesBuilders
Advertise
AdvertiseAffiliates (50%)Newsletter
LoginSign up
Sign in
StartupSubmit

StartupSubmit

Get higher ranking on Google & LLMs through 250+ Directories

VeilProxy

VeilProxy

Enterprise LLM sanitization and PII stripping proxy

LaunchDirectories

LaunchDirectories

Boost visibility and build backlinks through top directories

Spanora, AI Agent Observability Platform

Spanora, AI Agent Observability Platform

See what AI agents do and what they cost

Calm Sea

Calm Sea

Plan your financial future with visual, stress-free tools

Manifest

Manifest

Take control of your OpenClaw costs

ScopeSnap

ScopeSnap

Surface missing scope before it breaks your estimate.

Maced AI

Maced AI

Autonomous AI pentesting for code and infrastructure

SANSARA

SANSARA

a quiet kind of empathy

Advertise

Premium spot available

ManifestManifest
ScopeSnapScopeSnap
Maced AIMaced AI
SANSARASANSARA
Billing NowBilling Now
ManifestManifest
ScopeSnapScopeSnap
Maced AIMaced AI
SANSARASANSARA
Billing NowBilling Now
HomeProperty Forecast
Property Forecast

Property Forecast

Data analytics for real estate investors

D
@devinp4bl
Published on Nov 6, 2025
Visit site
1PeerPush
PeerPush badge for Property Forecast
X
Analytics & MonitoringAI Tools

Description

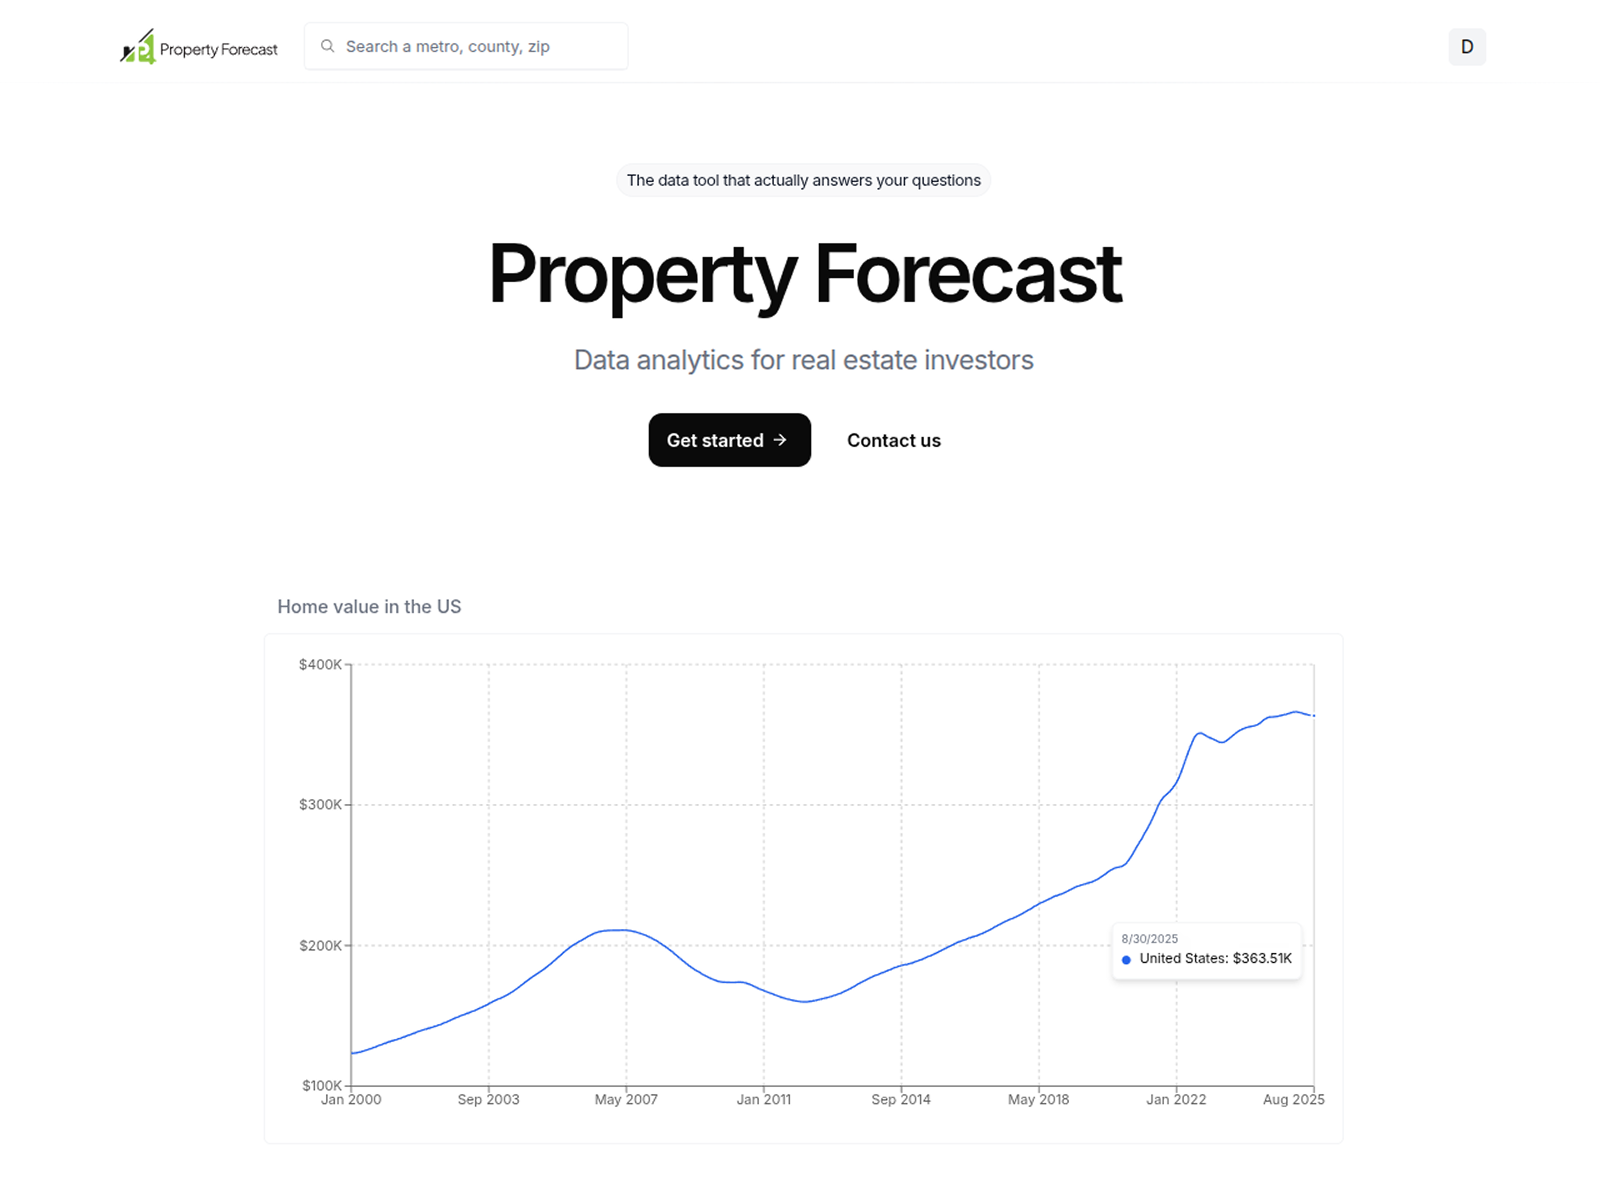
Property Forecast is the real estate data tool that actually answers your questions. Analyze 40k US regions with 80 metrics and 100m+ data points. Discover markets, compare trends, visualize data, and forecast outcomes. Key Features - 
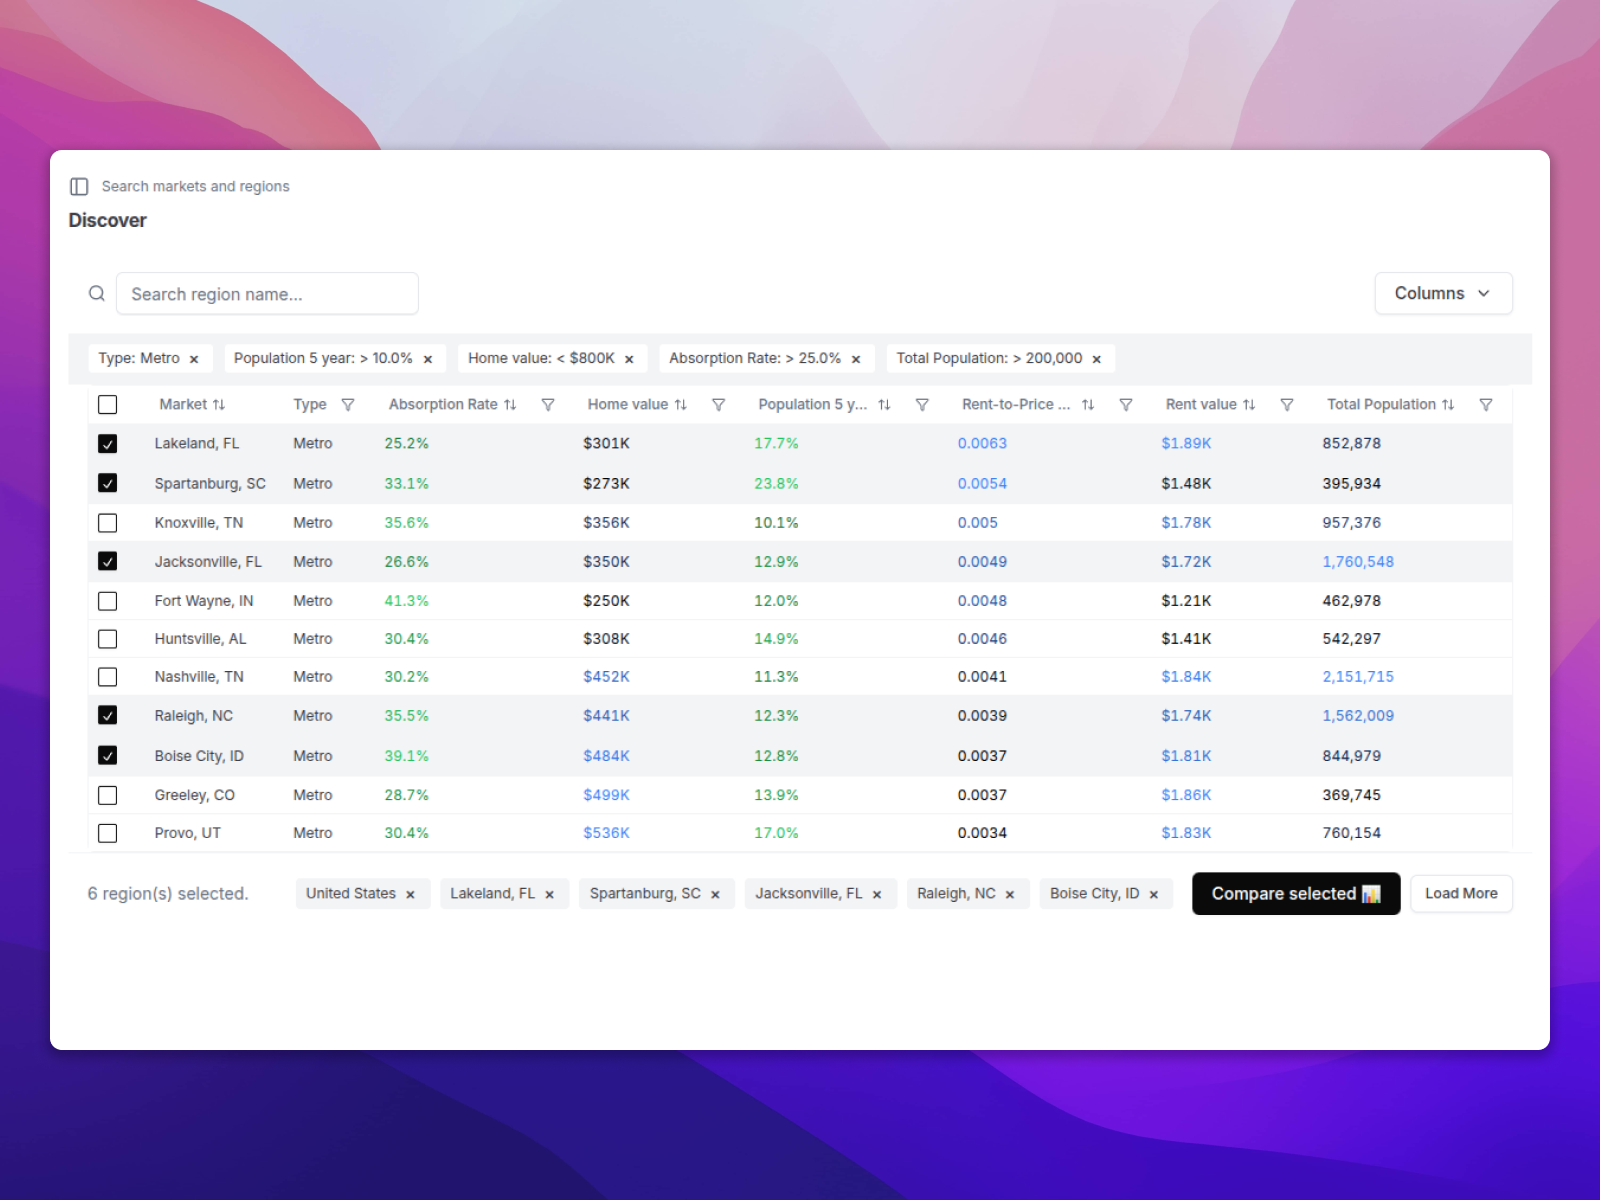
Discover: Search, filter, and sort across 40k US regions (metros, counties, zip codes) by the metrics that matter to you - 
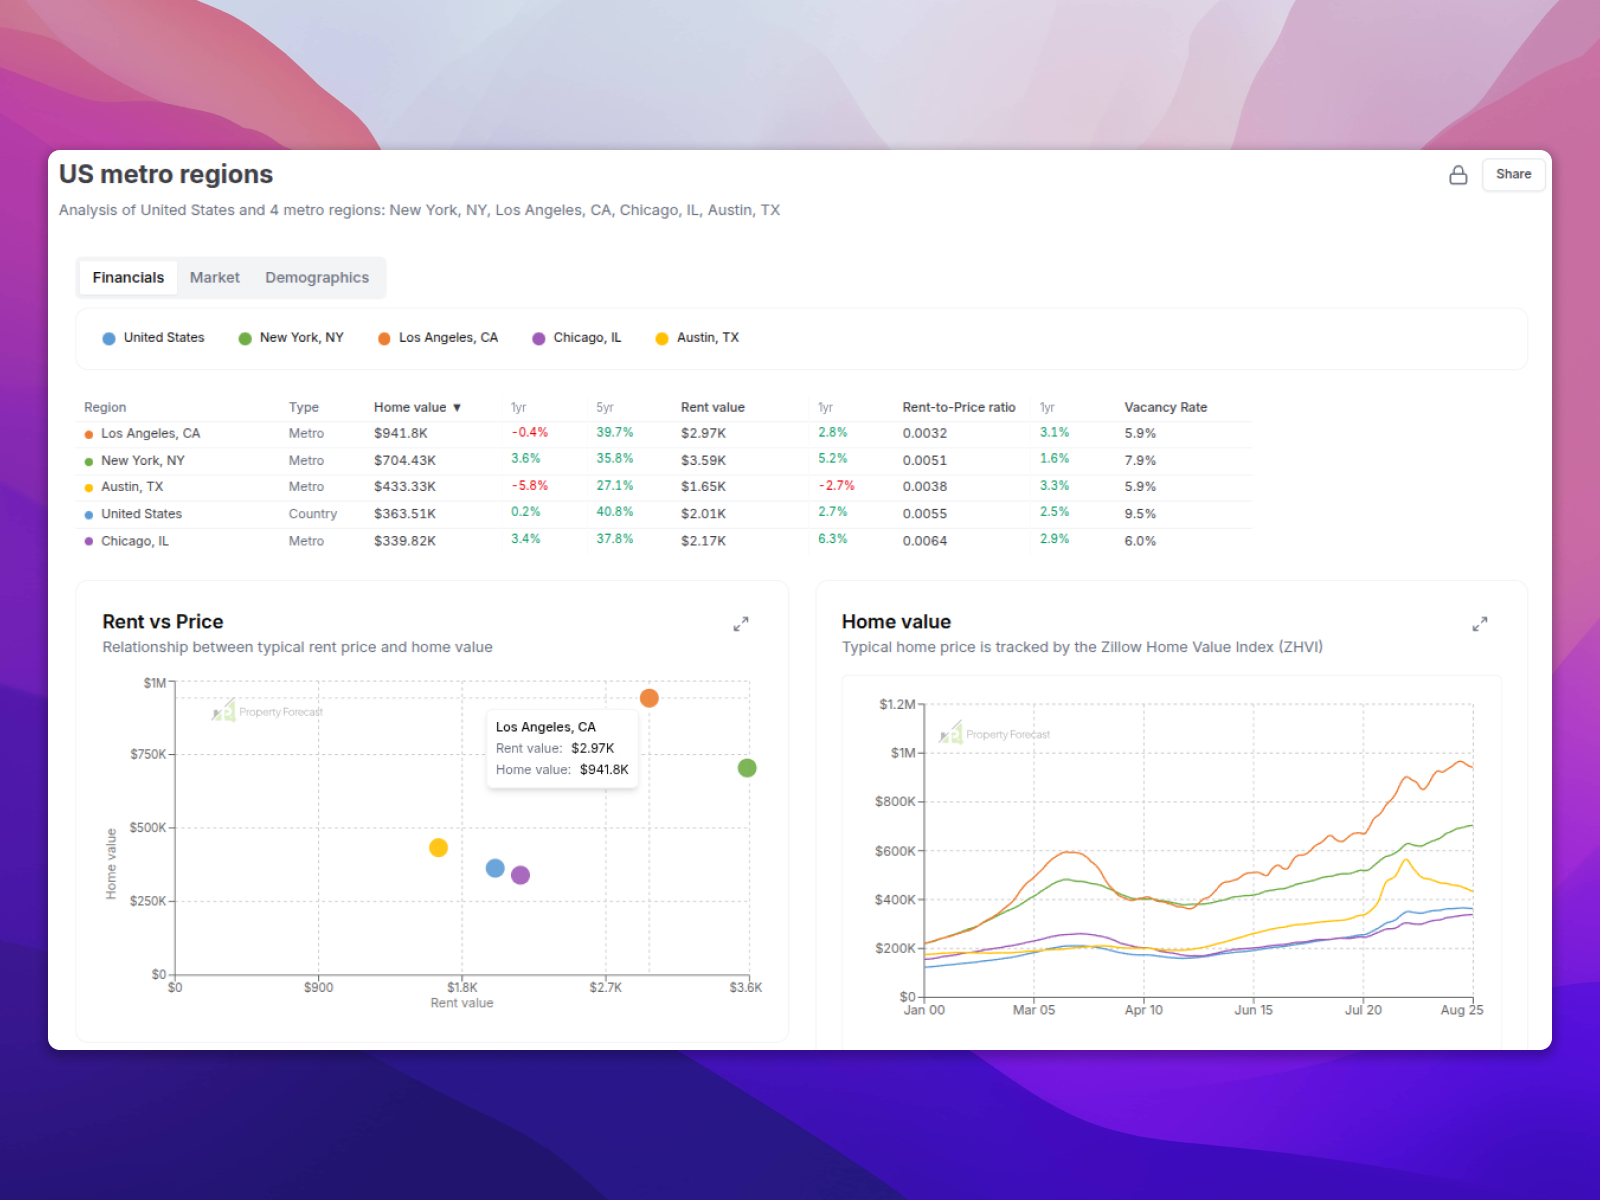
Compare: Side-by-side comparison of selected markets across 80+ metrics - Visualize: Interactive charts and data tables to easily interpret historical trends and live data - Analyze: Dig deeper into individual markets with raw metrics, underlying data, trend breakdowns, and forecasts - Track: Monitor trends, favorite markets, and custom reports from your dashboard, with automatic data updates that keep insights fresh - Forecast: Forecasting models predict outcomes of key metrics to understand where markets are heading Benefits - Interactive data: P4 datasets are dynamic and continuously updated - discovery, comparison, visualization, and analysis tools use live data, not static reports - Visualizations: Intuitive charts and visual comparisons make complex historical trends and live data easily interpretable - Hyperlocal: Granular forecasts and data analysis at the neighborhood and block level provide specialized insights for individual properties - AI-driven UX: Natural language interactions, ML forecasting, and AI analysis provide a simple and intuitive user experience

Screenshots

Screenshot 1 of Property ForecastScreenshot 2 of Property ForecastScreenshot 3 of Property Forecast

Product Updates (0)

No updates yet. Check back later for updates from the team.

Comments (0)

No comments yet. Be the first to share your thoughts!

You may also like

Cracked.AI

Cracked.AI

Scale Your Product with AI Influencers

AI ToolsSocial Media & Influencer ToolsProduct Marketing
1094PeerPush
🥈#2 of the Month
23
Loamly

Loamly

See the visitors ChatGPT sends you — they convert 4x

AI ToolsAnalytics & MonitoringFree & Open Source
1110PeerPush
🥇#1 of the Week
22
$99MRR
3

Domain Rating

72

Powered by Ahrefs
AboutAdvertisePartnershipsFAQPrivacyTermsLinkedInX/TwitterInstagramThreads