
Revisit – Session Recording & Analytics
Understand every user action with AI-powered insights
Details
- Categories
- AIDeveloper ToolsAnalytics & Monitoring
- Target Audience
- Product ManagersQA EngineersFrontend Developers
- Platforms
- Web
- Featured in
- Best Bug Tracking Tools
About Revisit – Session Recording & Analytics
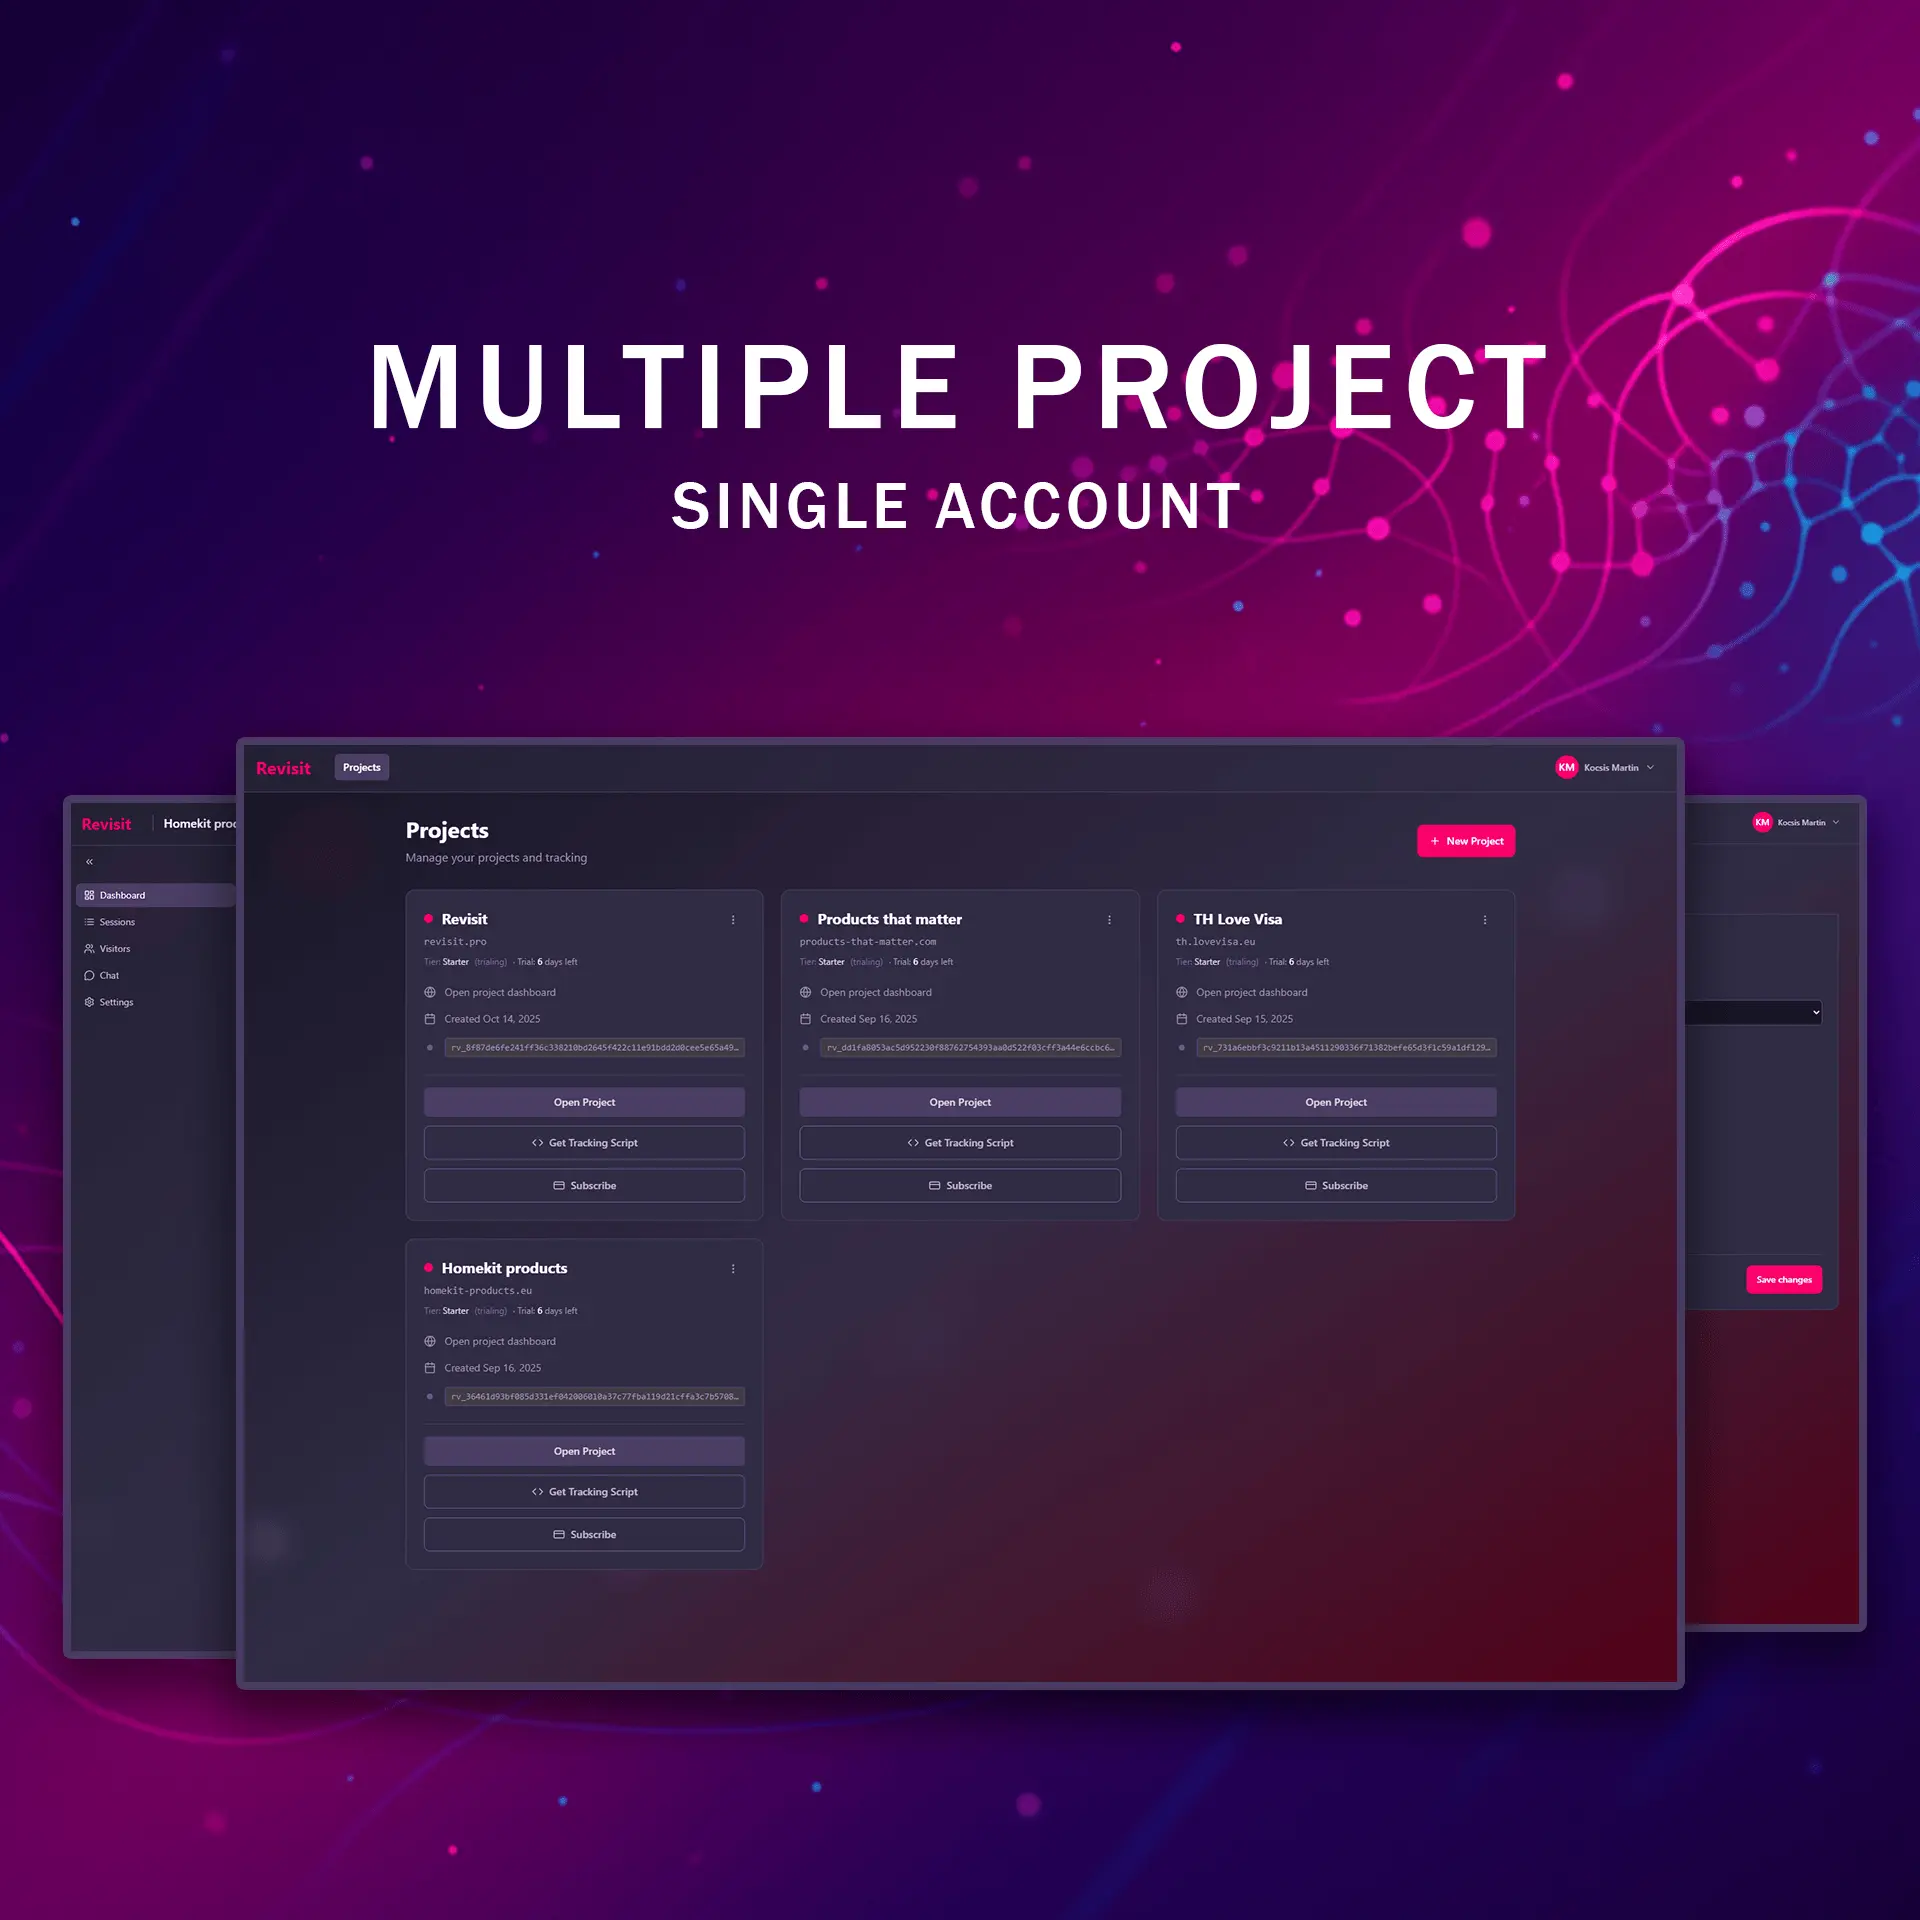
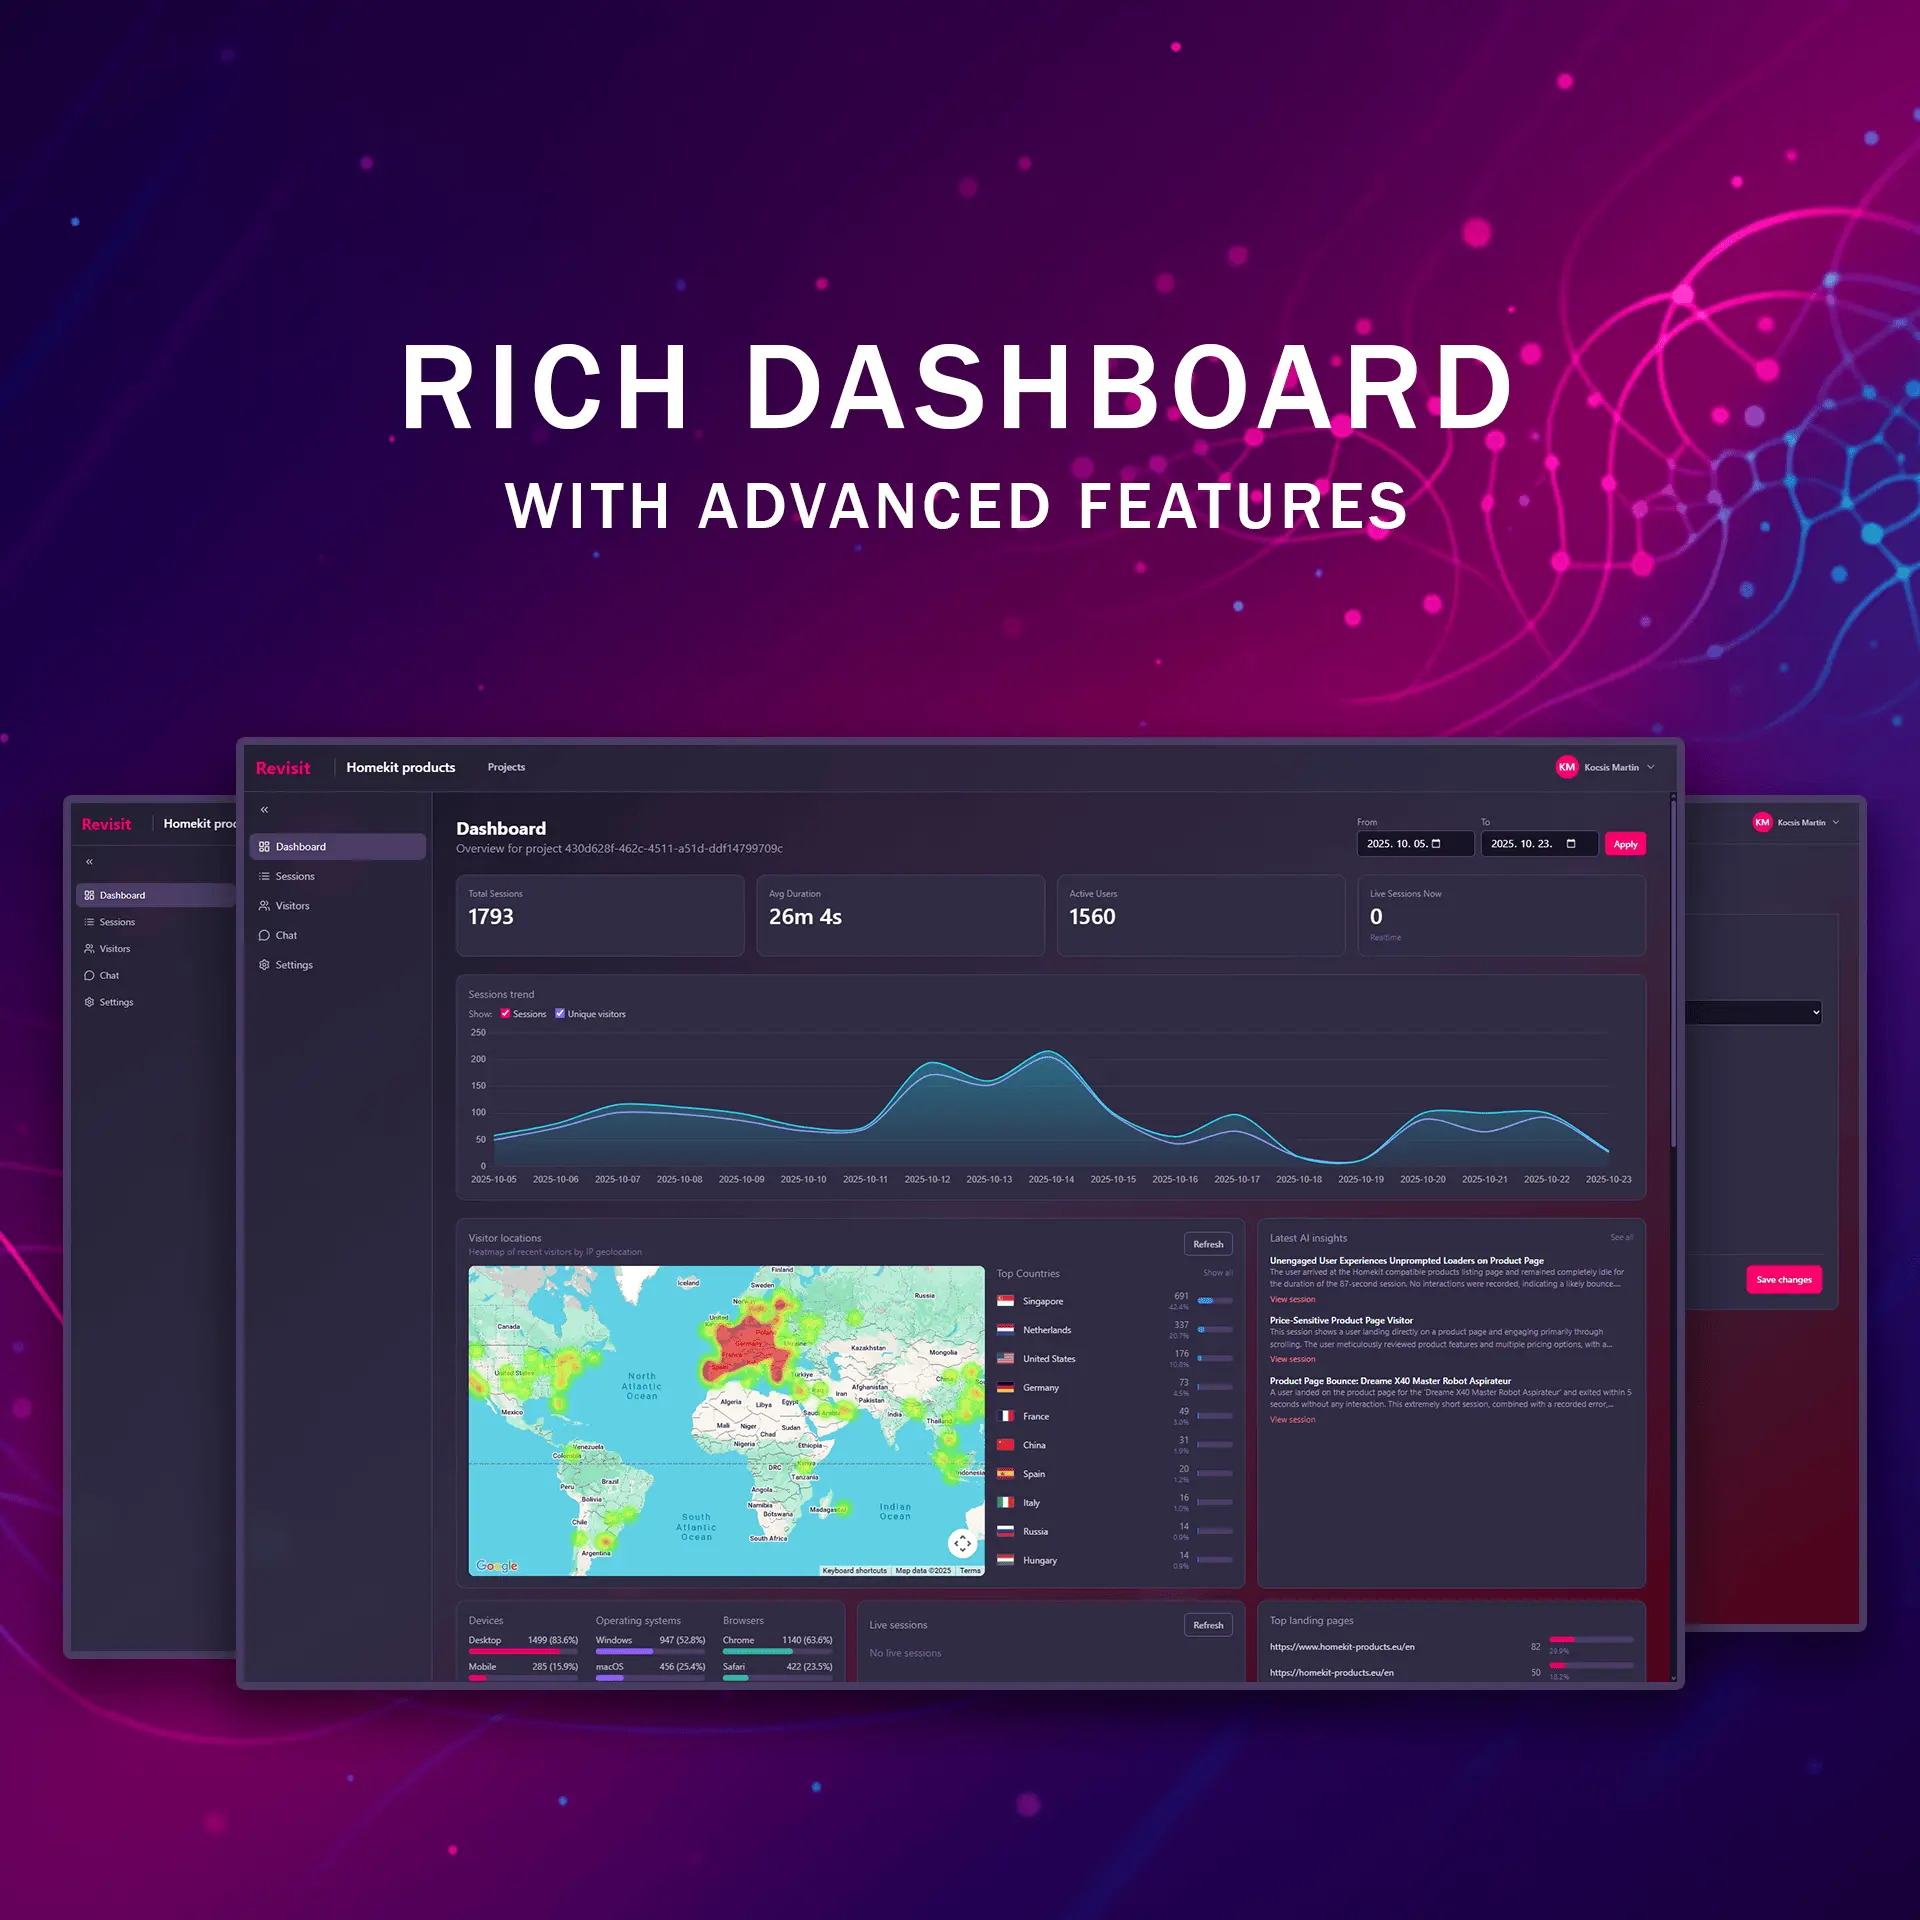
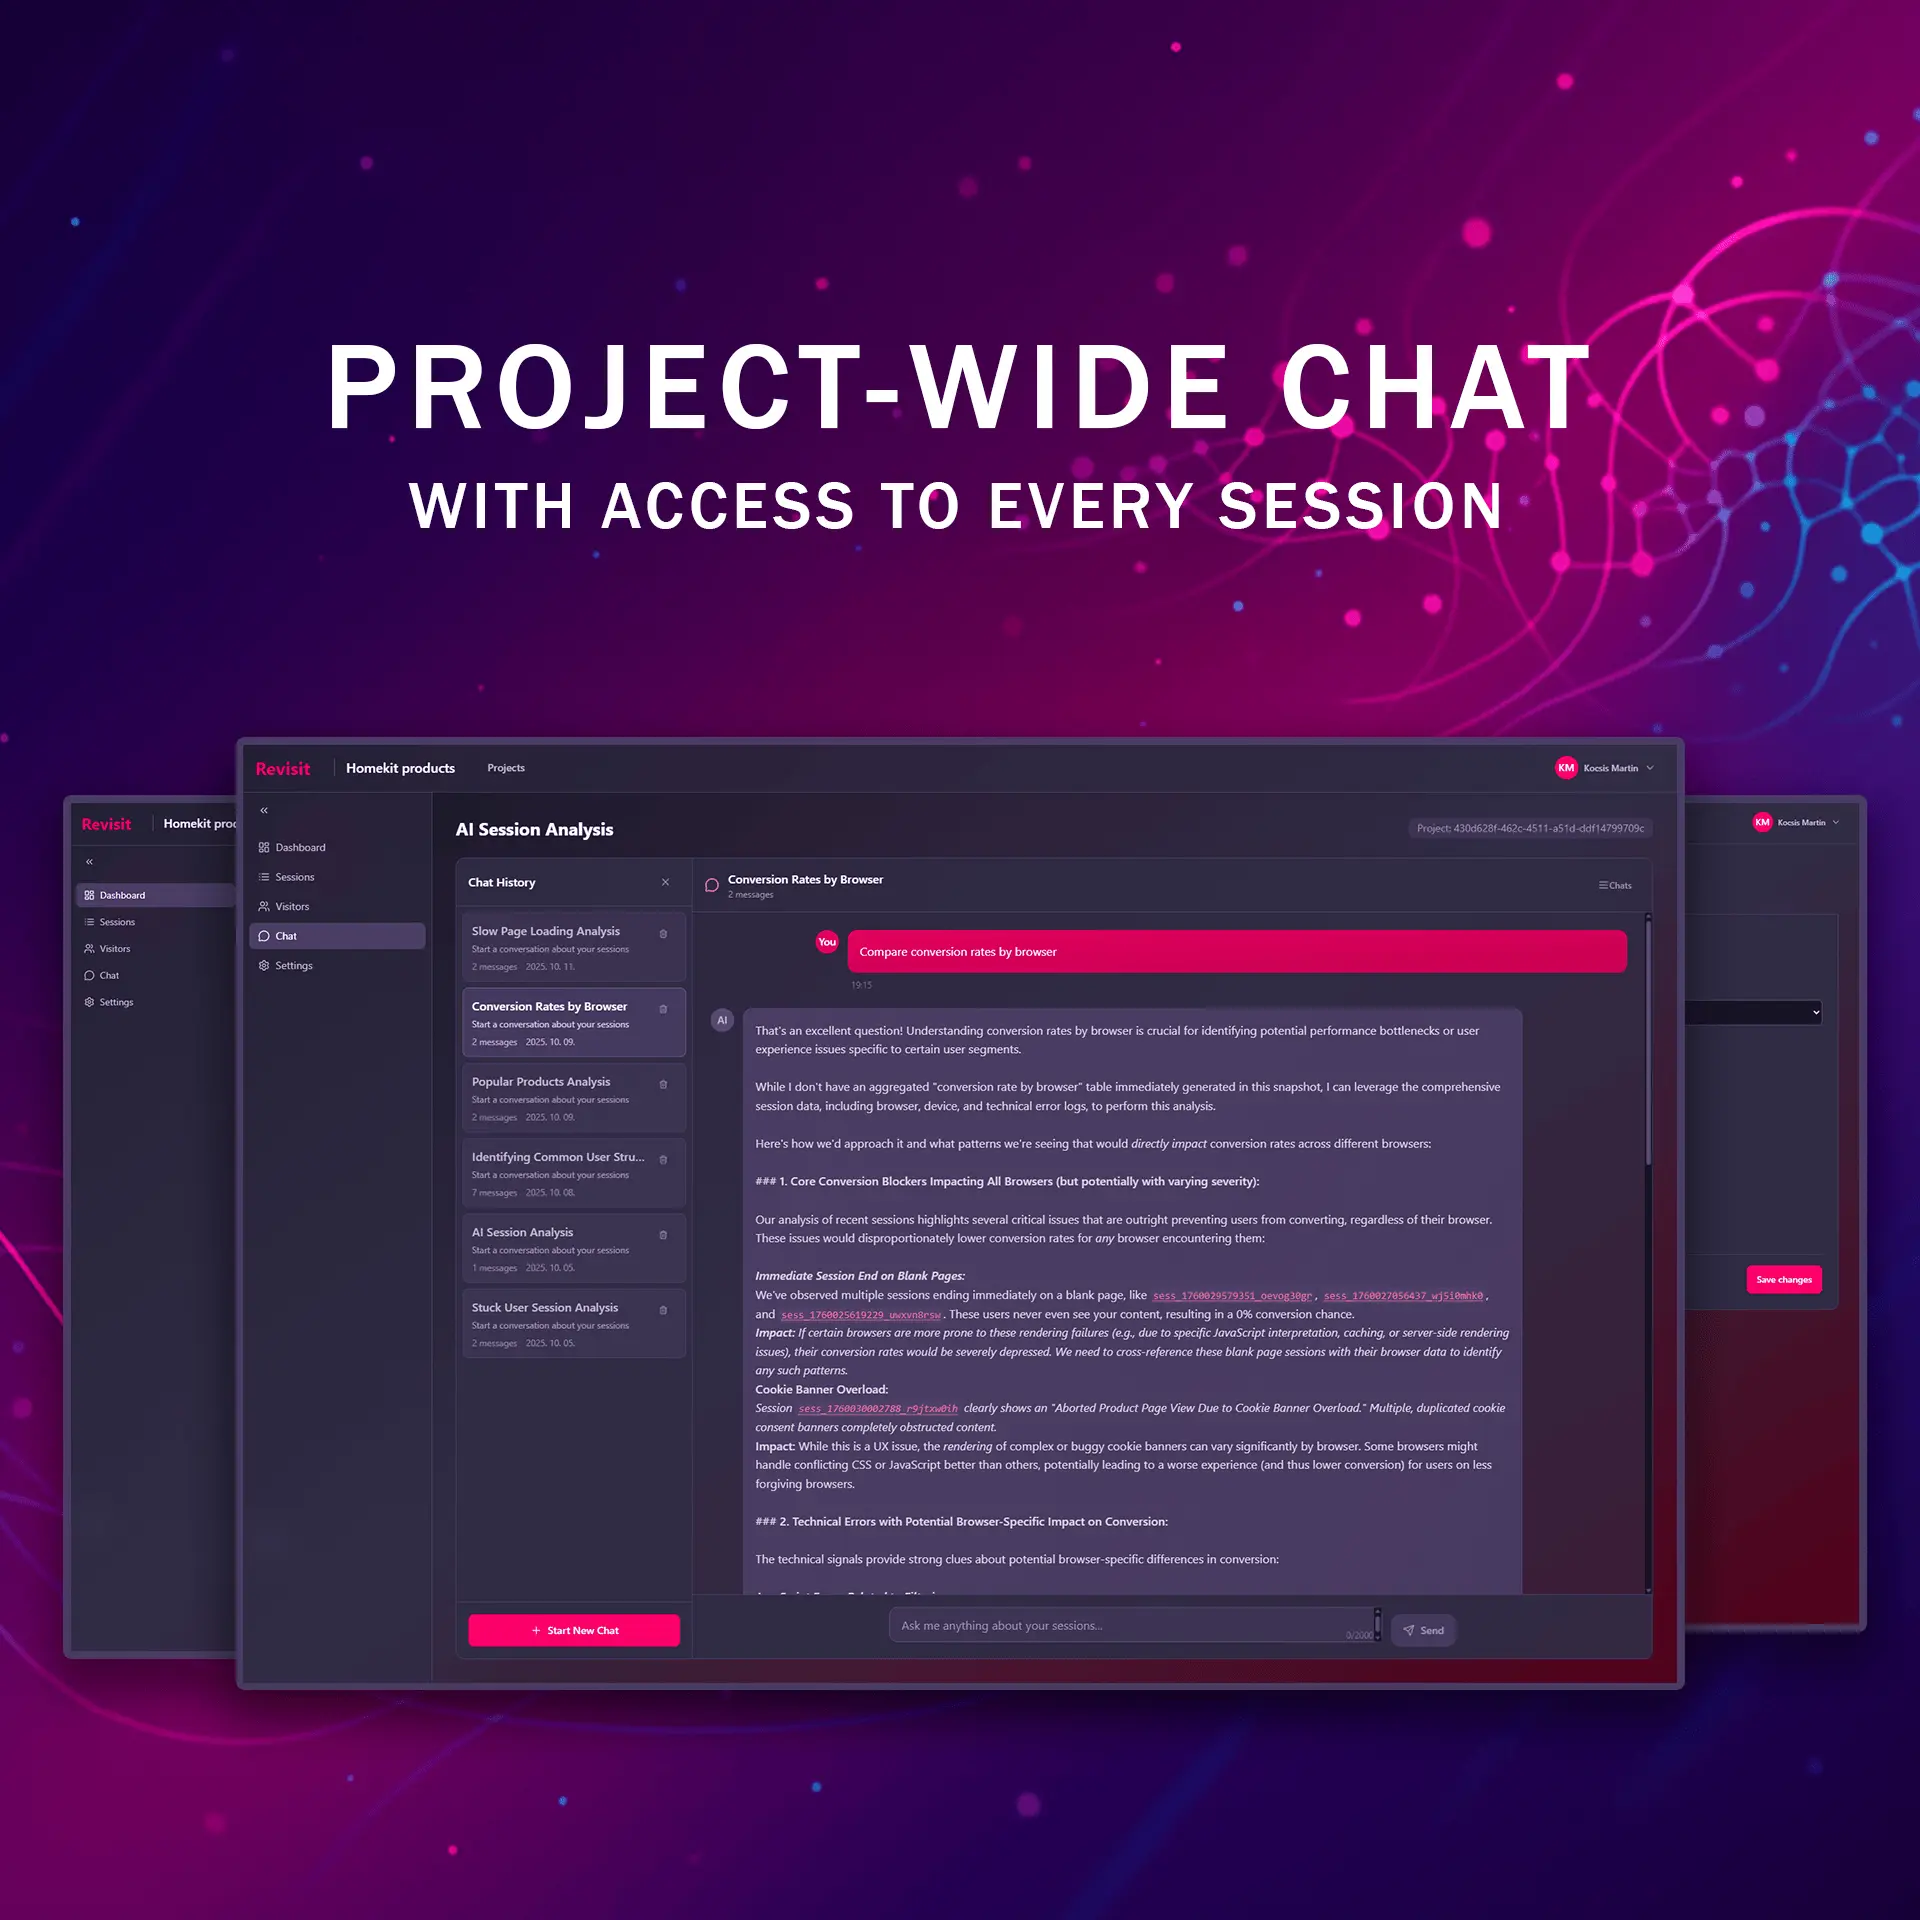
Revisit helps you understand the full story behind your product metrics with pixel‑perfect replays, live viewing, and built‑in DevTools (console, network, assets). You don’t have to watch thousands of sessions—our AI watches them for you, detects friction, and highlights the most useful, interesting sessions so you can focus on what matters. Investigate faster, prioritize with confidence, and ship better experiences. Key features Pixel‑perfect session replay: Initial DOM snapshot + mutations for accurate, multi-page journeys. Live mode: Stream ongoing sessions in real time for instant debugging. DevTools for replays: Console, network, and asset panels to mirror browser debugging. AI insights: Automatic struggle detection, timeline highlights, and session summaries. Search & context: Filter by referrer, UTM, device, and more to find the sessions that matter. Video export: Render replays to MP4 for sharing with teammates or stakeholders. Why Revisit Accuracy: DOM serialization + asset pipeline deliver faithful replays (including multi-tab flows). Speed: Lightweight recorder (vanilla TypeScript) with batching and compression. Deep debugging: Replay-time console, network, and asset insights—no guesswork. Actionable signals: AI flags friction moments so you don’t have to watch every minute. Who it’s for Product & Growth: See why users drop off and what features actually land. Engineers & QA: Reproduce bugs quickly with console/network trails. Support: Watch what customers experienced—no back-and-forth. How it works Install a tiny script. Revisit captures the initial DOM and streams changes/events. Watch replays, inspect timeline/console/network, and export if needed. Get started Try it: https://revisit.pro Add the script: Start seeing your first recordings in minutes -Martin
Product Insights
Revisit is a web-based analytics and monitoring platform that combines pixel-perfect session replays with built-in browser DevTools for deep technical inspection. It utilizes AI to automate friction detection and session summarization, filtering high-value insights for product and engineering teams.
- Integrated DevTools including console, network, and asset panels synchronized with session replays.
- AI-powered struggle detection and session summaries to highlight critical user friction points.
- Real-time live mode for instant debugging and streaming of ongoing user sessions.
- High-fidelity DOM serialization and asset pipelining for accurate multi-page journey reproduction.
Ideal for: Product Managers, QA Engineers, and Frontend Developers who need to identify user drop-off points and reproduce bugs using precise technical logs and visual replays.
Screenshots


Reviews (0)
No reviews yet. Be the first to rate this product!
Comments (1)
I like pixel perfect :-)