Signara
Reports that explain themselves. No analyst needed
Details
- Categories
- Analytics & Monitoring
- Pricing
- Freemium
- Platforms
- Web
About Signara
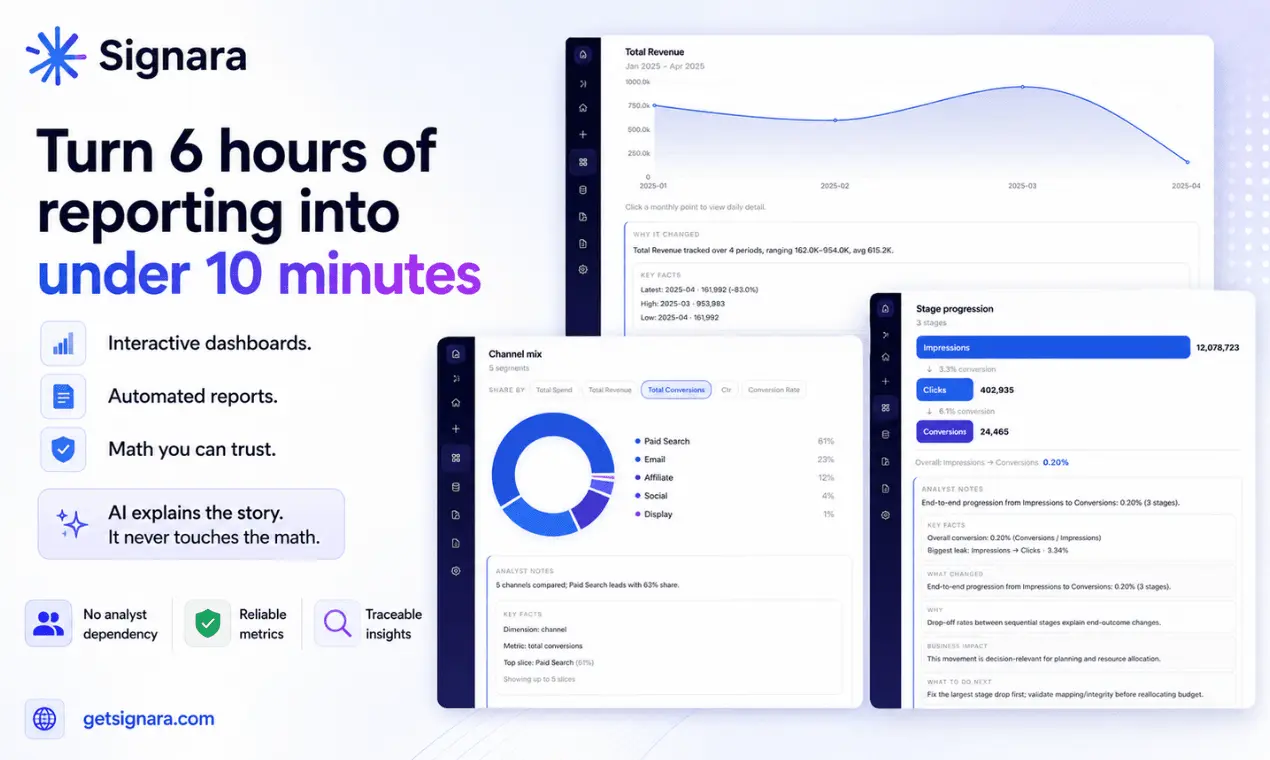
Signara turns raw data into deterministic KPIs, executive narratives, and presentation-ready dashboards automatically. Connect HubSpot, Google Sheets, BigQuery, Snowflake, or upload Excel files directly. Signara generates interactive dashboards in minutes, with built-in narrative explanations so users don't need an analyst to interpret the output. What makes it different: Deterministic math underneath, so numbers reconcile exactly to source data AI explains the story, but never touches the calculations (no hallucinated numbers) Built-in chart explanations remove analyst dependency Customisable KPIs and reporting cadence per use case Works for marketing teams, agencies, operations leaders, and anyone running recurring reports Free tier available. No card required to start.
Product Insights
Signara is a web-based analytics and monitoring platform that automates reporting by generating interactive dashboards and narrative explanations directly from data sources. It offers a freemium model to convert raw data into deterministic KPIs without requiring Manual analyst interpretation.
- Supports multiple integrations including HubSpot, Google Sheets, BigQuery, Snowflake, and Excel.
- Ensures exact data reconciliation using deterministic math for calculations with AI limit to narrative explanations.
- Provides customizable KPIs and automated reporting cadences designed for recurring reports.
Ideal for: Signara is ideal for Founders & CEOs, Marketing & Consulting Agencies, and Financial Analysts who need automated, self-explaining dashboards and recurring reports.
Product Video
Watch a video demo of Signara.
Screenshots
Reviews (2)
Average 4.5 out of 5
Based on 2 reviews

Plug in your data, get a dashboard with KPIs and narrative explanations. The deterministic math piece is genuinely useful, numbers match source data every time. Saves the team real hours each month on client reports. Setup was quick and the narrative explanations on each chart mean non-technical stakeholders don't need someone walking them through the numbers.
Comments (1)
Plug in your data, dashboard runs itself. The narrative explanations on each chart are the standout for me. Solid for recurring client reporting.