CliqSpy
See every Google Ad your competitors are running

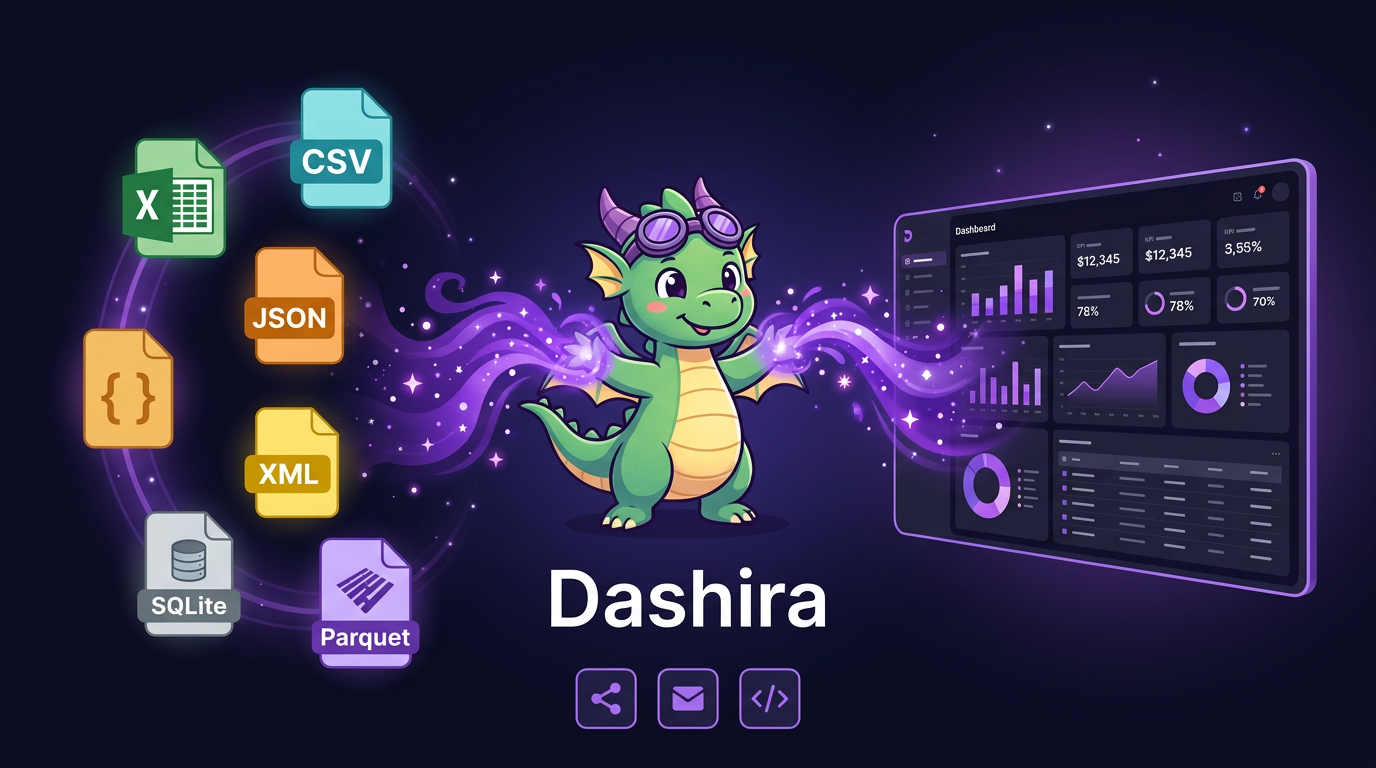
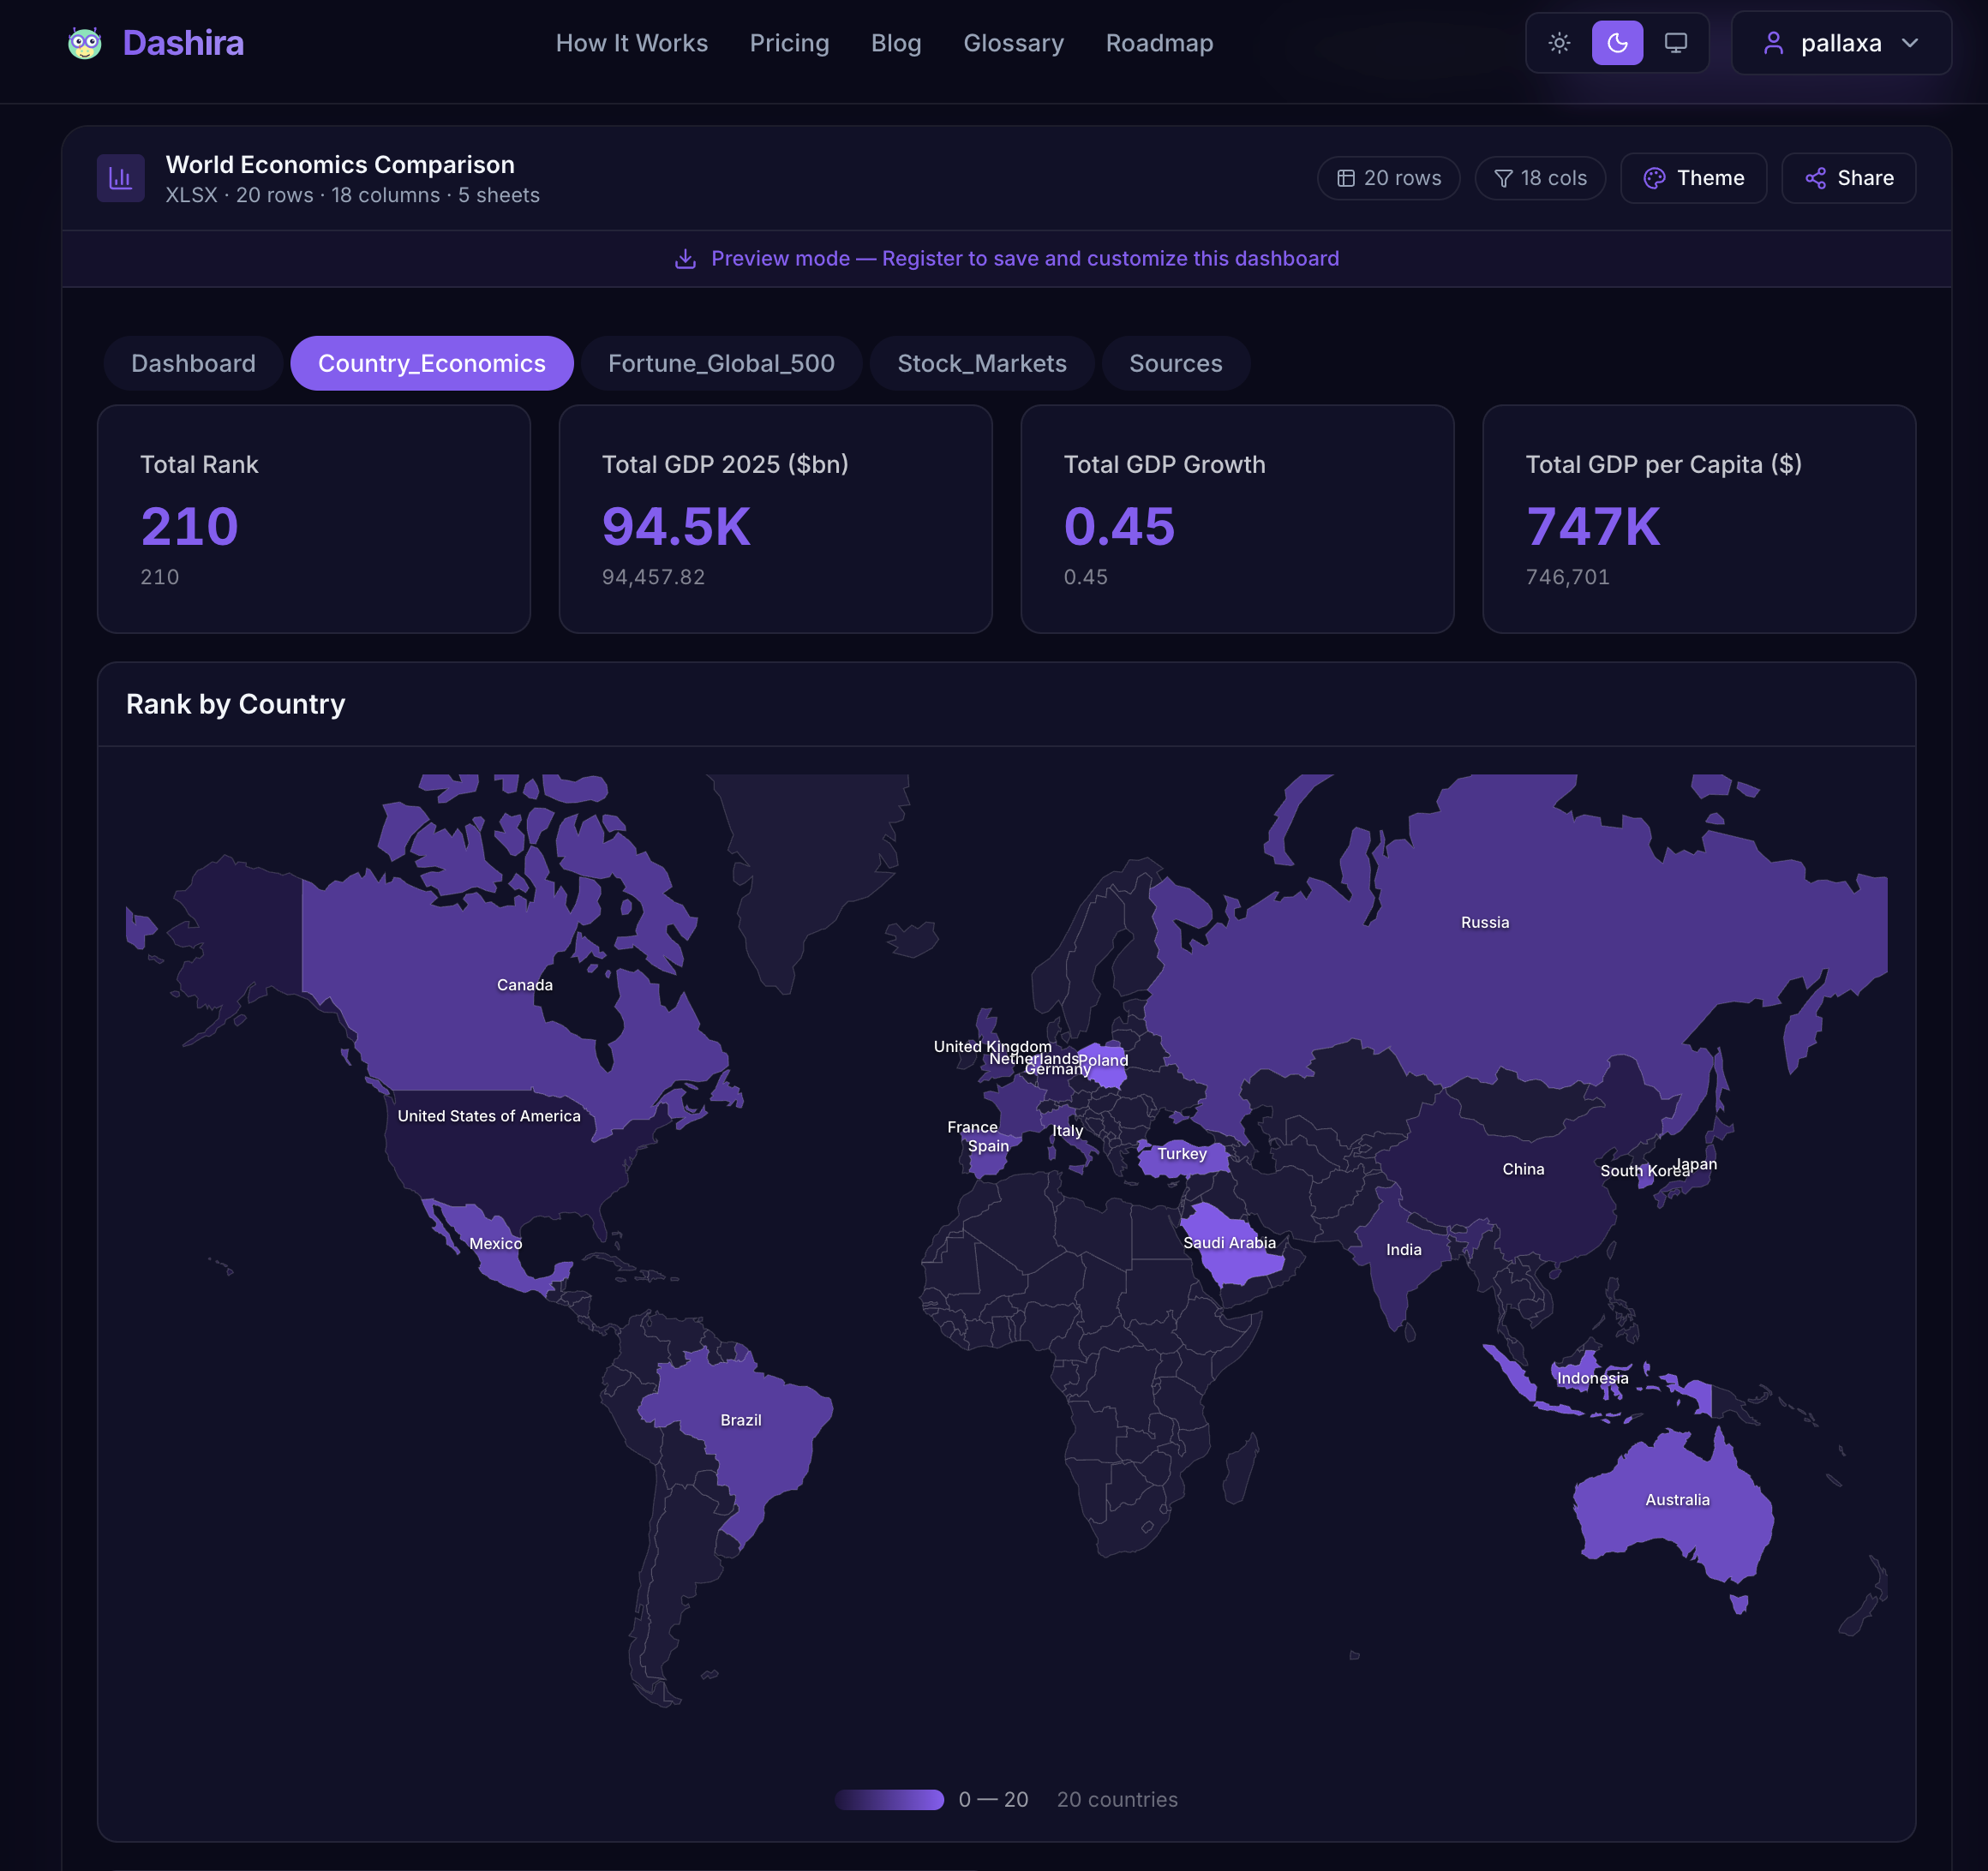
Turn your data into beautiful and shareable dashboards

Dashira is a web-based platform that converts diverse data files into interactive dashboards and dual-interface APIs. It bridges the gap between spreadsheet data and automated reporting for technical and non-technical stakeholders.
Ideal for: Product Managers, Data Scientists, and Non-Technical Users can utilize this platform to transform static files into interactive reports and live API endpoints.

Love this. Shareable dashboards are such an underrated feature for teams. The ability to turn raw data into something visually clear and easy to share is genuinely useful.
No reviews yet. Be the first to rate this product!
Comments (10)
Congrats on the launch!
Love the product!!
Love the concept of turning raw data into visual dashboards without code. How does the data import work — CSV upload or API connections?
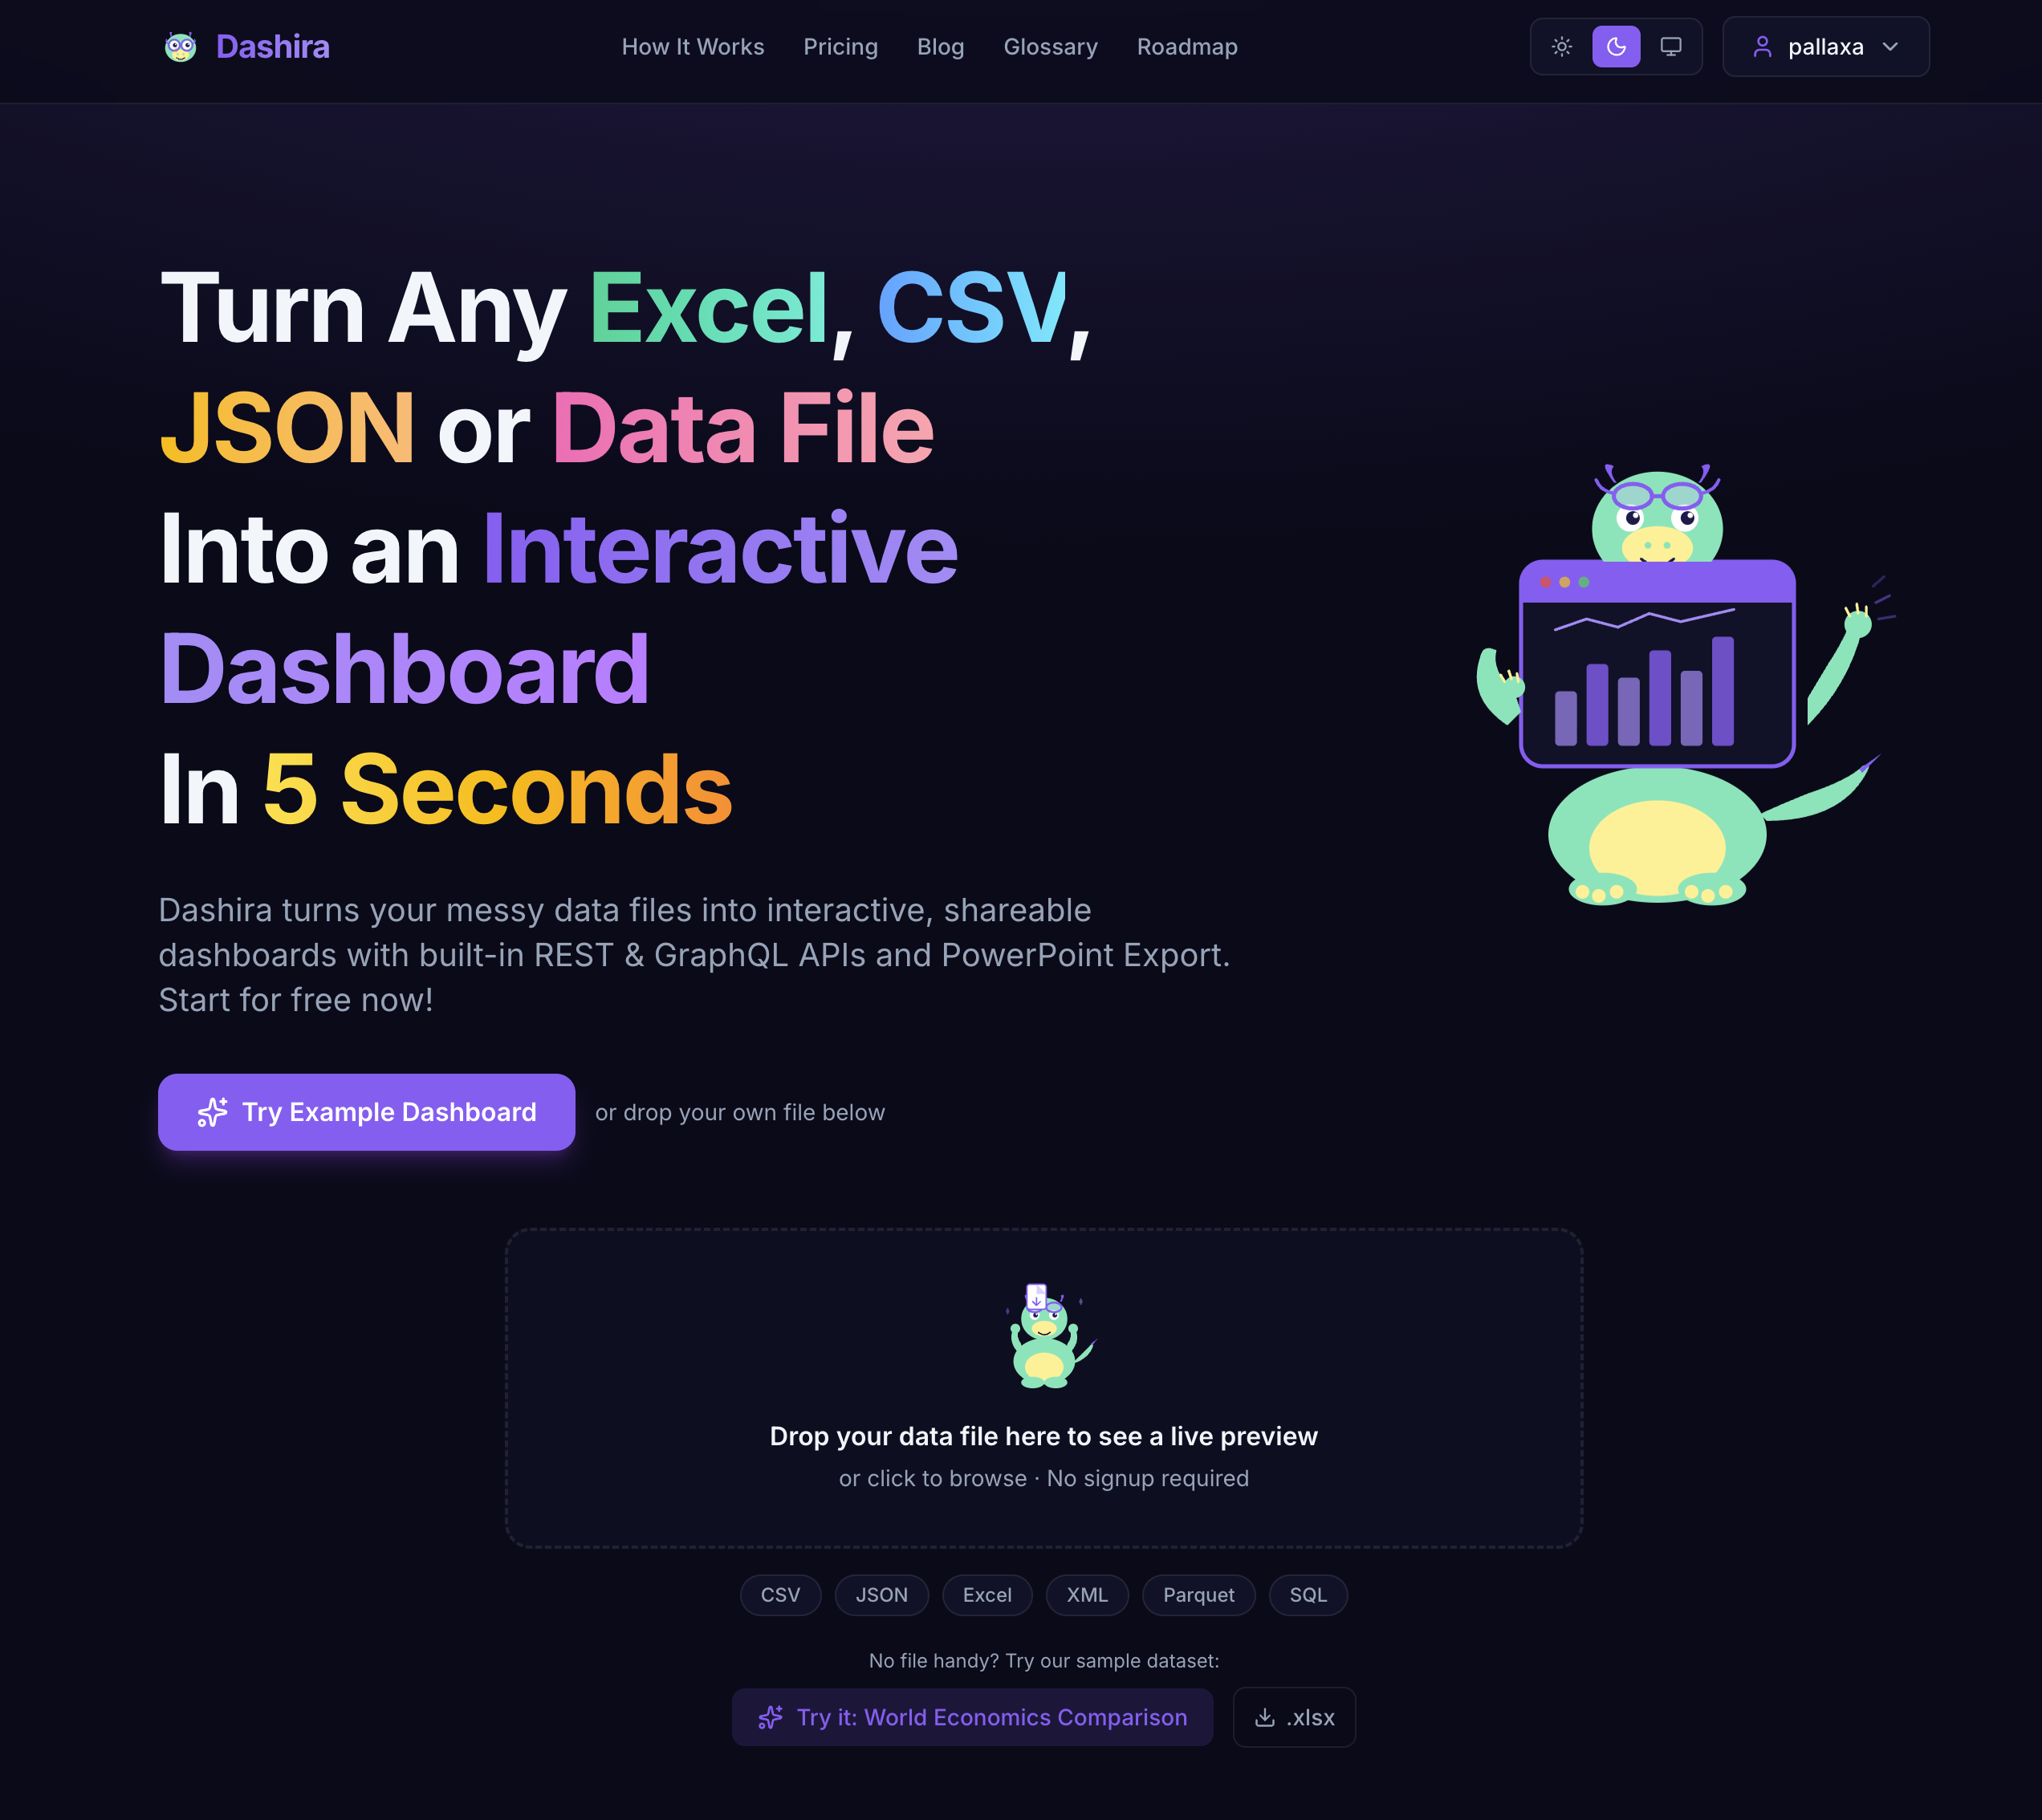
@support1202 both are possible any data input like json xml csv or you can also connect apis the agentic system in the background will guide you and figure out how to display your unstructured data
CSV to interactive dashboard in 5 seconds with built-in REST and GraphQL APIs is wild. The PowerPoint export is a nice touch too. Data storytelling made dead simple.
Love the product
@kaushal Thank u very much we keep improving
Very interesting one ,I built a similar one , on upload of CSV or EXCEL or XML or JSON, it detects Data Anomalies and raise it as incident, where you can download the report or send email . check out at thresholdiq.app
This idea of generating charts from data is really great and useful in many scenarios.
Really cool concept — turning raw data into shareable dashboards in seconds is a game changer for quick reporting.
great timing with a project I'm working on total lifesaver!
Any data format or feature missing just let me know we are happy to support your use case!