
Make Graph
Online Free Graph Maker
@bimohxh
Details
- Categories
- Design Tools
- Target Audience
- Data ScientistsEducatorsStudents
- Platforms
- Web
About Make Graph
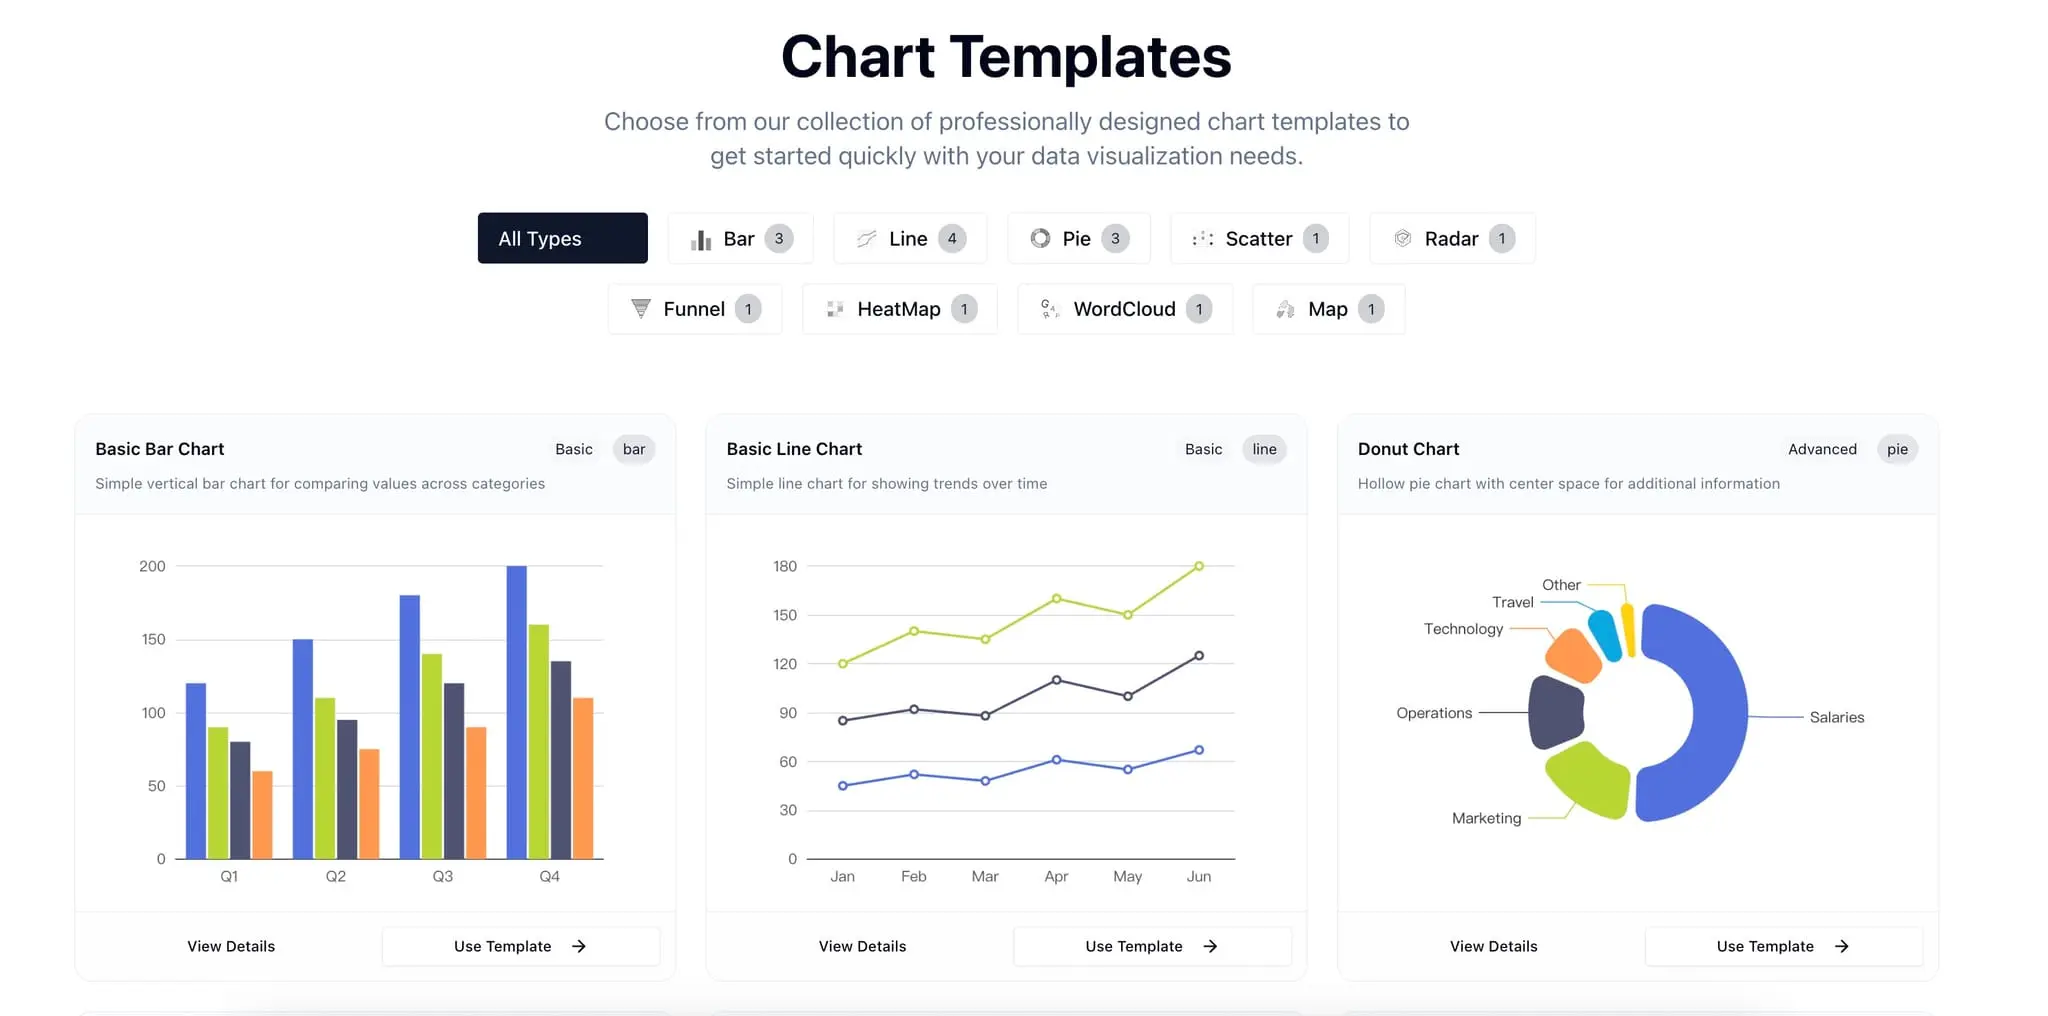
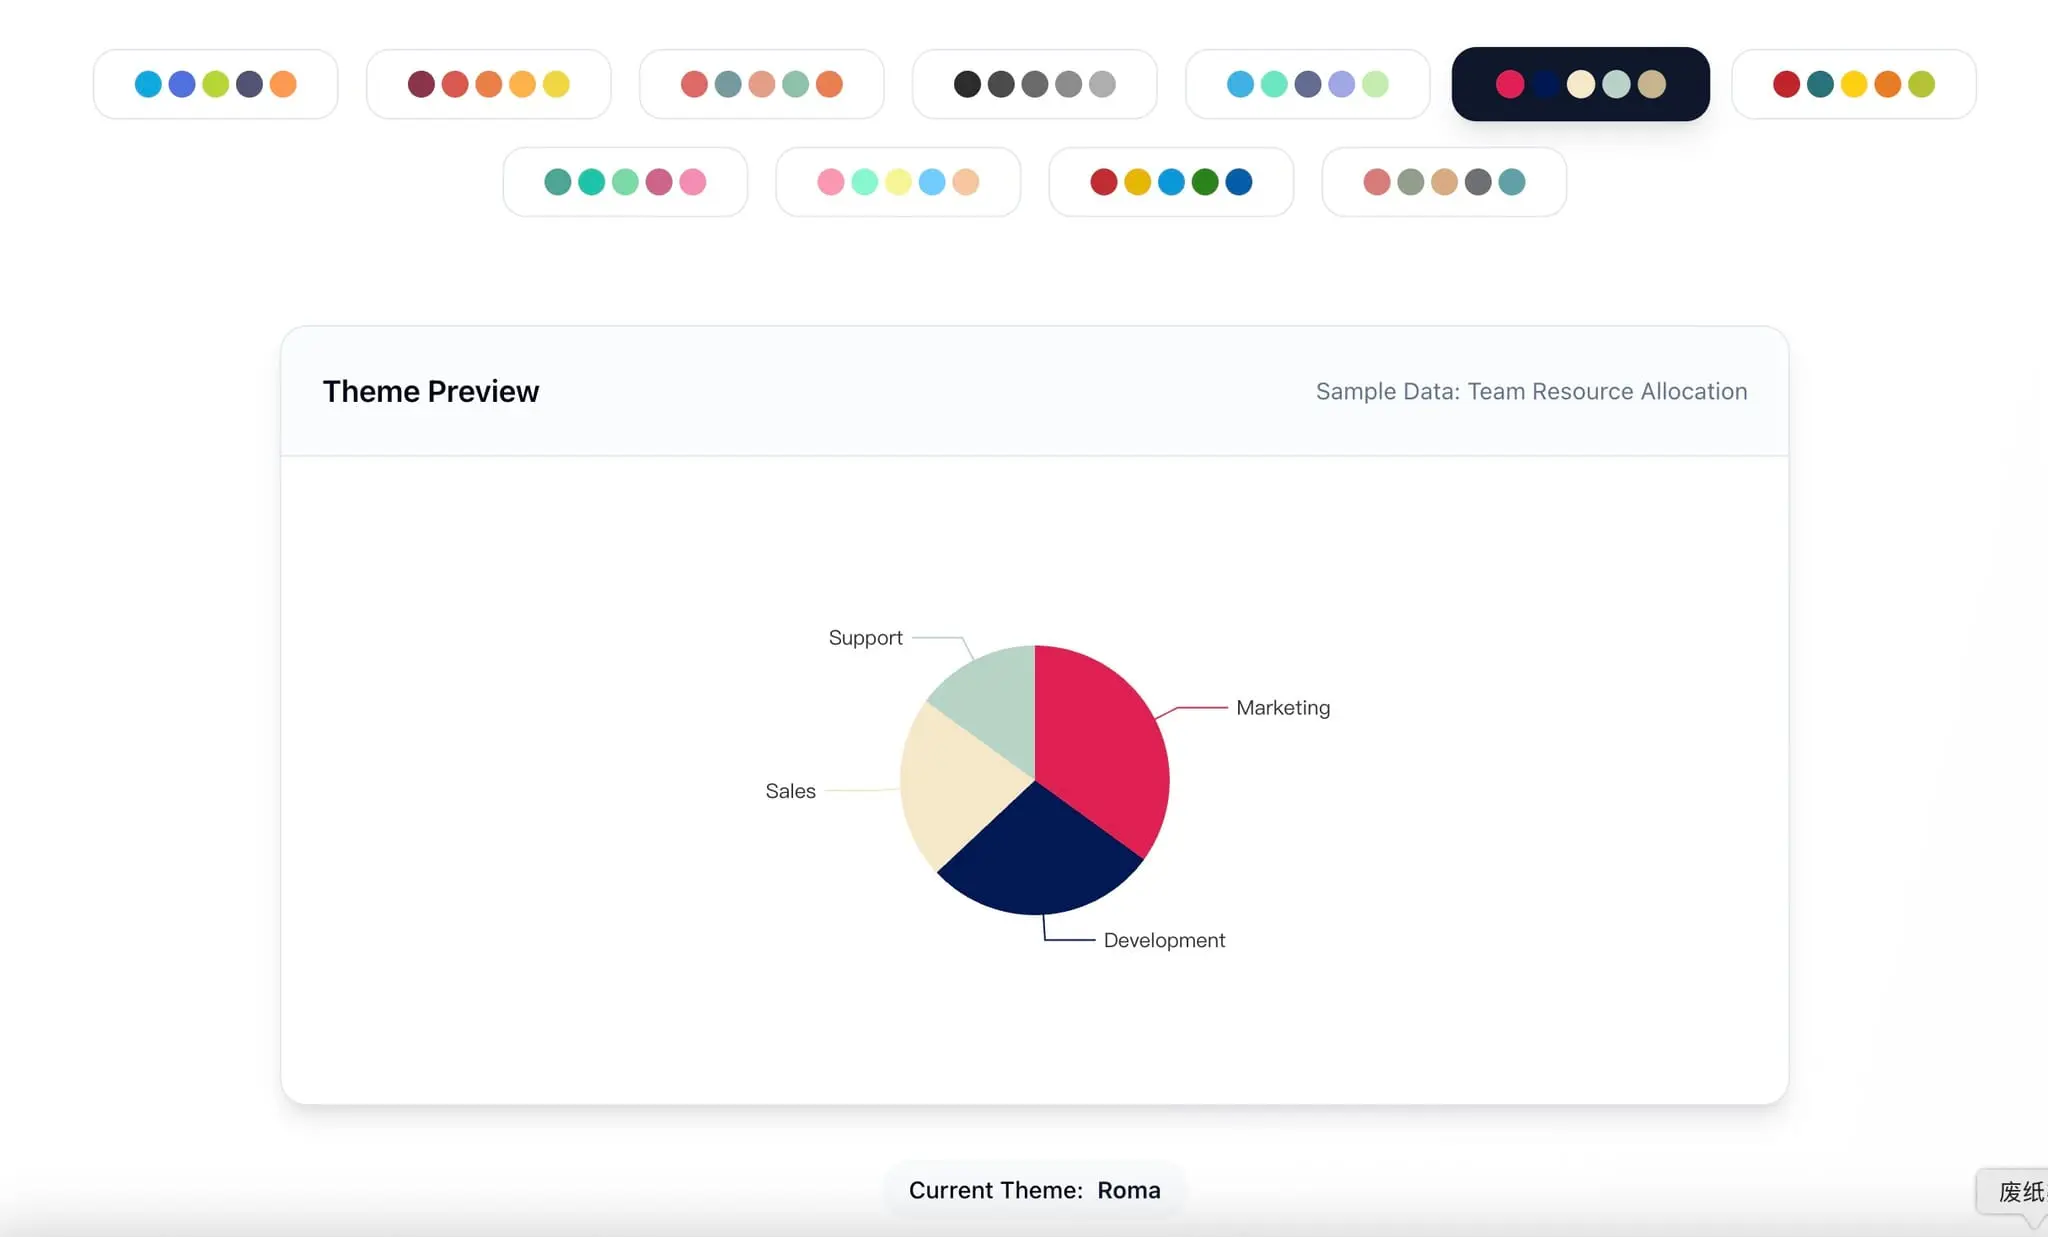
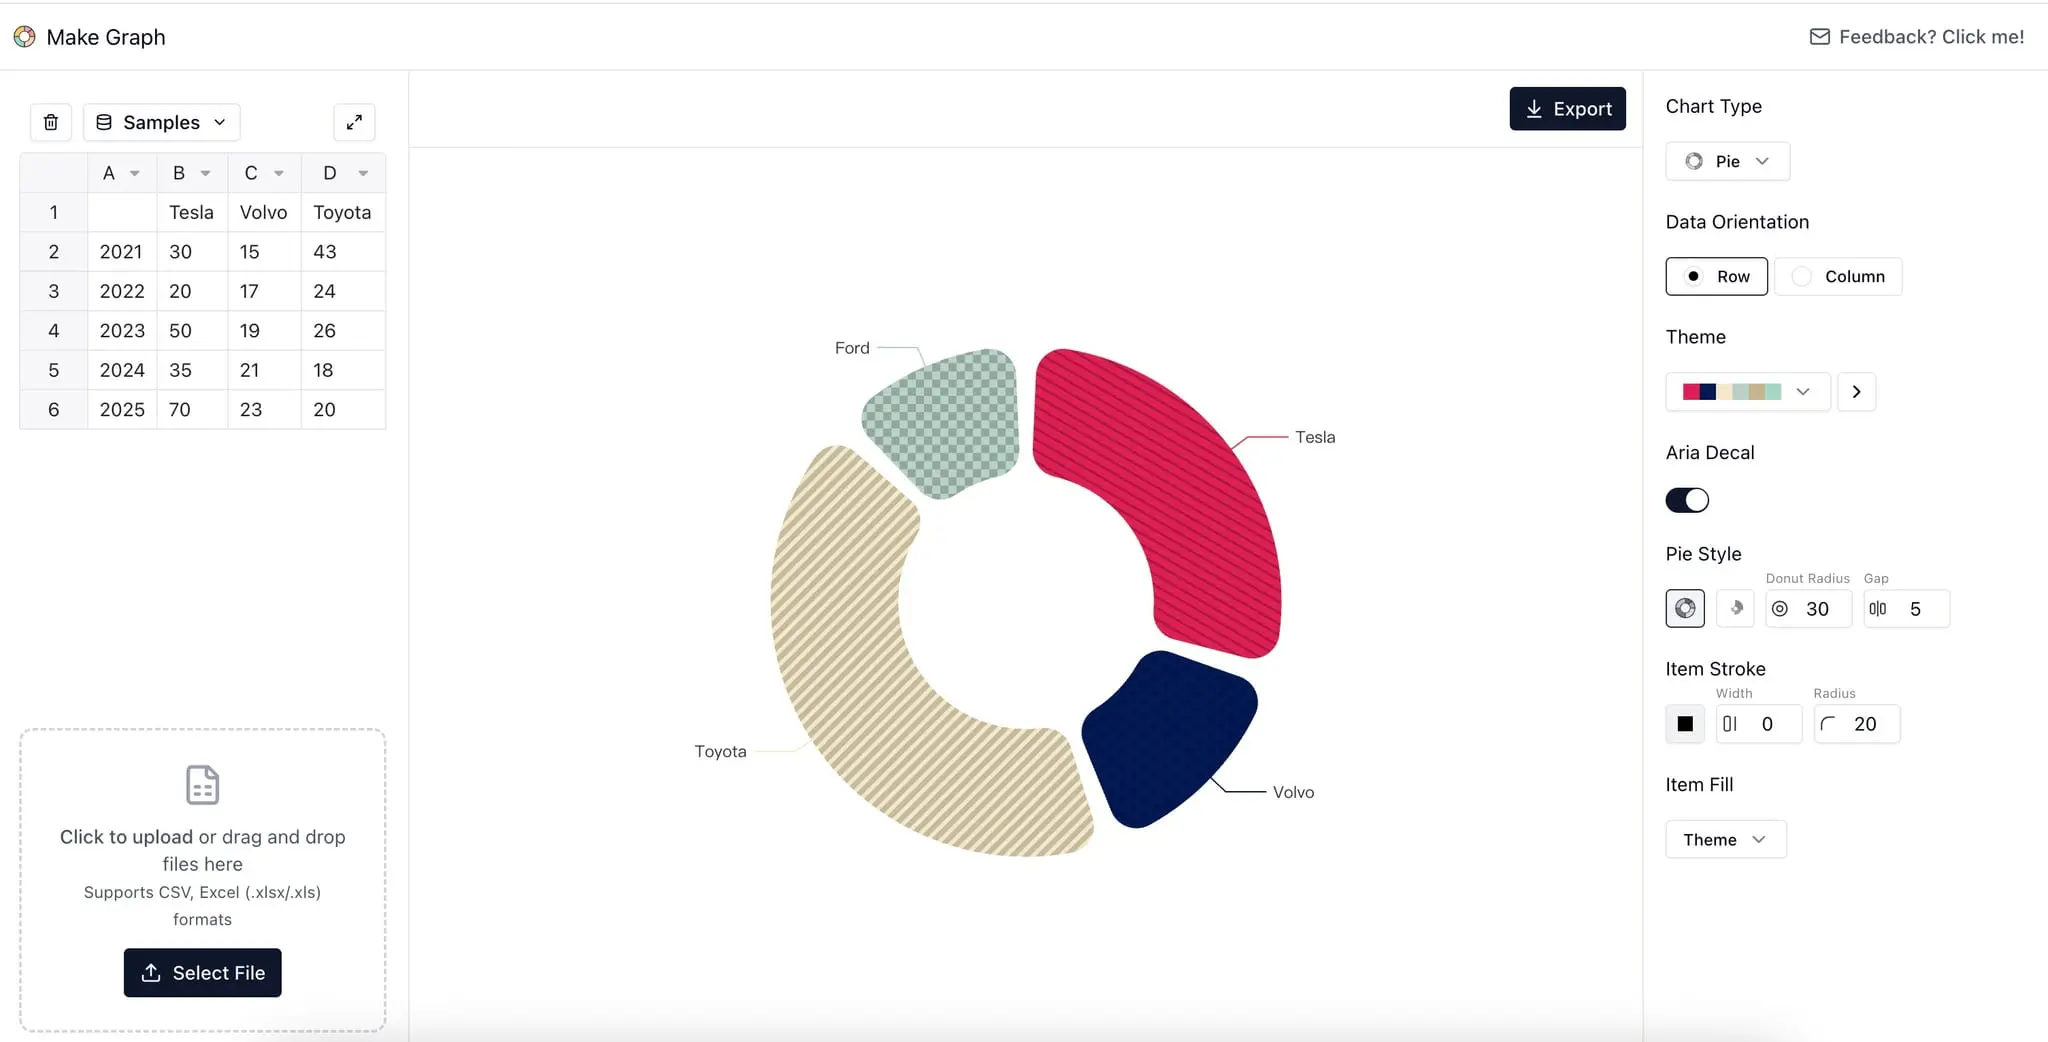
makegraph.app is a free online chart-making website that can create standard charts such as bar charts, line charts, and pie charts. It also supports the creation of box plots and maps, allows free customization of data and styles, supports theme switching, and enables SVG export.
Product Insights
Make Graph is a web-based design tool for creating and customizing standard and complex data visualizations. It provides educators, students, and data scientists with various chart formats including box plots and maps.
- Supports specialized visualization formats like box plots and geographic maps.
- Enables theme switching and style customization for personalized chart design.
- Provides SVG export functionality for high-quality graphic output.
- Accessible as a free online platform without software installation.
Ideal for: Data scientists, educators, and students can use this tool to generate and export custom charts for data analysis and reporting tasks.
Screenshots
Reviews (0)
No reviews yet. Be the first to rate this product!
Comments (0)
No comments yet. Be the first to share your thoughts!